Scottish vs Immigrants from Germany Female Disability
COMPARE
Scottish
Immigrants from Germany
Female Disability
Female Disability Comparison
Scottish
Immigrants from Germany
13.0%
FEMALE DISABILITY
0.1/ 100
METRIC RATING
278th/ 347
METRIC RANK
12.7%
FEMALE DISABILITY
1.3/ 100
METRIC RATING
255th/ 347
METRIC RANK
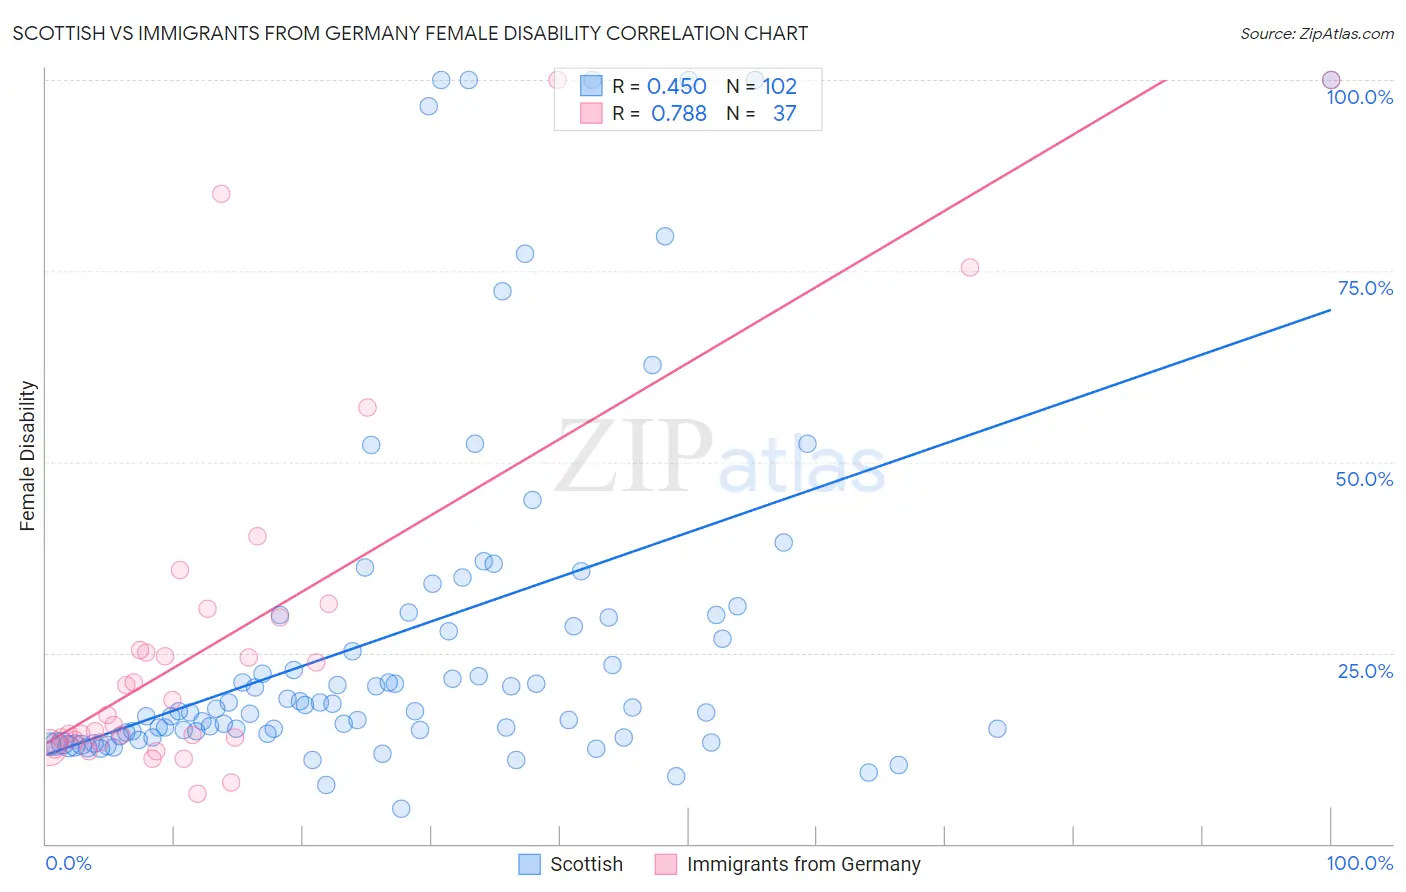
Scottish vs Immigrants from Germany Female Disability Correlation Chart
The statistical analysis conducted on geographies consisting of 566,851,987 people shows a moderate positive correlation between the proportion of Scottish and percentage of females with a disability in the United States with a correlation coefficient (R) of 0.450 and weighted average of 13.0%. Similarly, the statistical analysis conducted on geographies consisting of 463,857,992 people shows a strong positive correlation between the proportion of Immigrants from Germany and percentage of females with a disability in the United States with a correlation coefficient (R) of 0.788 and weighted average of 12.7%, a difference of 2.5%.
Female Disability Correlation Summary
| Measurement | Scottish | Immigrants from Germany |
| Minimum | 4.6% | 6.6% |
| Maximum | 100.0% | 100.0% |
| Range | 95.4% | 93.4% |
| Mean | 27.6% | 27.4% |
| Median | 17.8% | 16.9% |
| Interquartile 25% (IQ1) | 14.4% | 13.4% |
| Interquartile 75% (IQ3) | 30.0% | 30.2% |
| Interquartile Range (IQR) | 15.6% | 16.8% |
| Standard Deviation (Sample) | 24.0% | 24.5% |
| Standard Deviation (Population) | 23.9% | 24.2% |
Similar Demographics by Female Disability
Demographics Similar to Scottish by Female Disability
In terms of female disability, the demographic groups most similar to Scottish are Spanish (13.0%, a difference of 0.080%), Arapaho (13.0%, a difference of 0.24%), Immigrants from Dominica (13.0%, a difference of 0.28%), Irish (13.1%, a difference of 0.33%), and Cheyenne (13.0%, a difference of 0.34%).
| Demographics | Rating | Rank | Female Disability |
| Dutch | 0.2 /100 | #271 | Tragic 12.9% |
| Germans | 0.1 /100 | #272 | Tragic 12.9% |
| Sioux | 0.1 /100 | #273 | Tragic 12.9% |
| Portuguese | 0.1 /100 | #274 | Tragic 13.0% |
| Cheyenne | 0.1 /100 | #275 | Tragic 13.0% |
| Immigrants | Dominica | 0.1 /100 | #276 | Tragic 13.0% |
| Spanish | 0.1 /100 | #277 | Tragic 13.0% |
| Scottish | 0.1 /100 | #278 | Tragic 13.0% |
| Arapaho | 0.1 /100 | #279 | Tragic 13.0% |
| Irish | 0.1 /100 | #280 | Tragic 13.1% |
| U.S. Virgin Islanders | 0.1 /100 | #281 | Tragic 13.1% |
| Welsh | 0.0 /100 | #282 | Tragic 13.1% |
| English | 0.0 /100 | #283 | Tragic 13.1% |
| Hmong | 0.0 /100 | #284 | Tragic 13.1% |
| Bangladeshis | 0.0 /100 | #285 | Tragic 13.1% |
Demographics Similar to Immigrants from Germany by Female Disability
In terms of female disability, the demographic groups most similar to Immigrants from Germany are British West Indian (12.7%, a difference of 0.070%), Hawaiian (12.7%, a difference of 0.080%), Liberian (12.7%, a difference of 0.10%), Aleut (12.7%, a difference of 0.10%), and Jamaican (12.7%, a difference of 0.11%).
| Demographics | Rating | Rank | Female Disability |
| Carpatho Rusyns | 2.0 /100 | #248 | Tragic 12.6% |
| Immigrants | Congo | 1.8 /100 | #249 | Tragic 12.7% |
| Slovenes | 1.7 /100 | #250 | Tragic 12.7% |
| Crow | 1.6 /100 | #251 | Tragic 12.7% |
| Immigrants | Caribbean | 1.4 /100 | #252 | Tragic 12.7% |
| Jamaicans | 1.4 /100 | #253 | Tragic 12.7% |
| Hawaiians | 1.4 /100 | #254 | Tragic 12.7% |
| Immigrants | Germany | 1.3 /100 | #255 | Tragic 12.7% |
| British West Indians | 1.2 /100 | #256 | Tragic 12.7% |
| Liberians | 1.1 /100 | #257 | Tragic 12.7% |
| Aleuts | 1.1 /100 | #258 | Tragic 12.7% |
| Immigrants | Armenia | 1.0 /100 | #259 | Tragic 12.7% |
| Sub-Saharan Africans | 1.0 /100 | #260 | Tragic 12.7% |
| Bermudans | 1.0 /100 | #261 | Tragic 12.7% |
| Czechoslovakians | 0.9 /100 | #262 | Tragic 12.7% |