Scottish vs Cree Female Disability
COMPARE
Scottish
Cree
Female Disability
Female Disability Comparison
Scottish
Cree
13.0%
FEMALE DISABILITY
0.1/ 100
METRIC RATING
278th/ 347
METRIC RANK
13.7%
FEMALE DISABILITY
0.0/ 100
METRIC RATING
308th/ 347
METRIC RANK
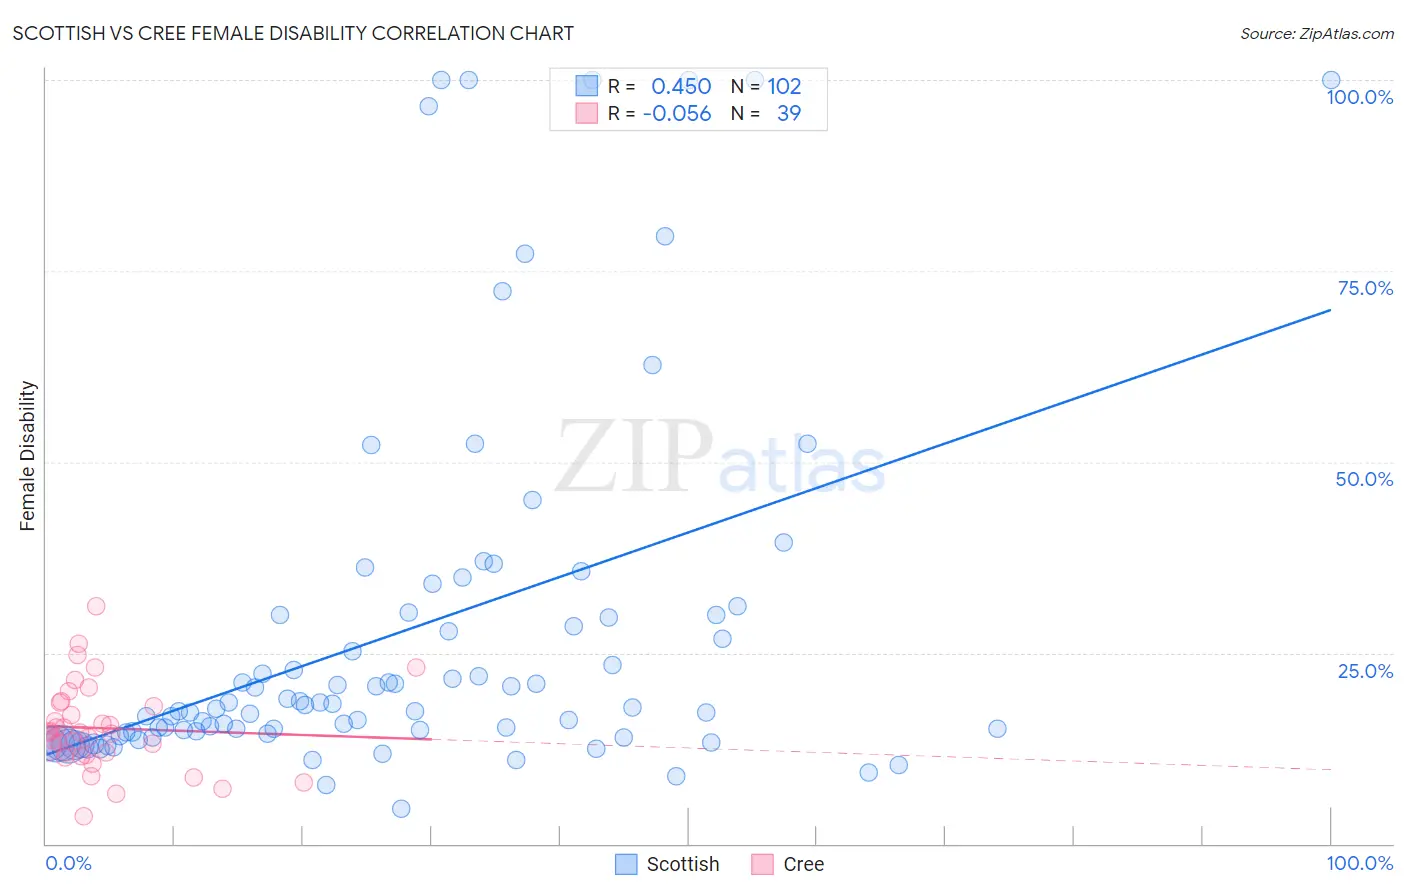
Scottish vs Cree Female Disability Correlation Chart
The statistical analysis conducted on geographies consisting of 566,851,987 people shows a moderate positive correlation between the proportion of Scottish and percentage of females with a disability in the United States with a correlation coefficient (R) of 0.450 and weighted average of 13.0%. Similarly, the statistical analysis conducted on geographies consisting of 76,204,869 people shows a slight negative correlation between the proportion of Cree and percentage of females with a disability in the United States with a correlation coefficient (R) of -0.056 and weighted average of 13.7%, a difference of 5.1%.
Female Disability Correlation Summary
| Measurement | Scottish | Cree |
| Minimum | 4.6% | 3.6% |
| Maximum | 100.0% | 31.2% |
| Range | 95.4% | 27.6% |
| Mean | 27.6% | 15.1% |
| Median | 17.8% | 14.6% |
| Interquartile 25% (IQ1) | 14.4% | 11.6% |
| Interquartile 75% (IQ3) | 30.0% | 18.6% |
| Interquartile Range (IQR) | 15.6% | 7.0% |
| Standard Deviation (Sample) | 24.0% | 5.7% |
| Standard Deviation (Population) | 23.9% | 5.6% |
Similar Demographics by Female Disability
Demographics Similar to Scottish by Female Disability
In terms of female disability, the demographic groups most similar to Scottish are Spanish (13.0%, a difference of 0.080%), Arapaho (13.0%, a difference of 0.24%), Immigrants from Dominica (13.0%, a difference of 0.28%), Irish (13.1%, a difference of 0.33%), and Cheyenne (13.0%, a difference of 0.34%).
| Demographics | Rating | Rank | Female Disability |
| Dutch | 0.2 /100 | #271 | Tragic 12.9% |
| Germans | 0.1 /100 | #272 | Tragic 12.9% |
| Sioux | 0.1 /100 | #273 | Tragic 12.9% |
| Portuguese | 0.1 /100 | #274 | Tragic 13.0% |
| Cheyenne | 0.1 /100 | #275 | Tragic 13.0% |
| Immigrants | Dominica | 0.1 /100 | #276 | Tragic 13.0% |
| Spanish | 0.1 /100 | #277 | Tragic 13.0% |
| Scottish | 0.1 /100 | #278 | Tragic 13.0% |
| Arapaho | 0.1 /100 | #279 | Tragic 13.0% |
| Irish | 0.1 /100 | #280 | Tragic 13.1% |
| U.S. Virgin Islanders | 0.1 /100 | #281 | Tragic 13.1% |
| Welsh | 0.0 /100 | #282 | Tragic 13.1% |
| English | 0.0 /100 | #283 | Tragic 13.1% |
| Hmong | 0.0 /100 | #284 | Tragic 13.1% |
| Bangladeshis | 0.0 /100 | #285 | Tragic 13.1% |
Demographics Similar to Cree by Female Disability
In terms of female disability, the demographic groups most similar to Cree are French American Indian (13.7%, a difference of 0.060%), Apache (13.7%, a difference of 0.18%), Central American Indian (13.6%, a difference of 0.46%), Hopi (13.7%, a difference of 0.46%), and French Canadian (13.6%, a difference of 0.75%).
| Demographics | Rating | Rank | Female Disability |
| Africans | 0.0 /100 | #301 | Tragic 13.4% |
| Scotch-Irish | 0.0 /100 | #302 | Tragic 13.4% |
| Immigrants | Portugal | 0.0 /100 | #303 | Tragic 13.5% |
| Immigrants | Micronesia | 0.0 /100 | #304 | Tragic 13.5% |
| Dominicans | 0.0 /100 | #305 | Tragic 13.5% |
| French Canadians | 0.0 /100 | #306 | Tragic 13.6% |
| Central American Indians | 0.0 /100 | #307 | Tragic 13.6% |
| Cree | 0.0 /100 | #308 | Tragic 13.7% |
| French American Indians | 0.0 /100 | #309 | Tragic 13.7% |
| Apache | 0.0 /100 | #310 | Tragic 13.7% |
| Hopi | 0.0 /100 | #311 | Tragic 13.7% |
| Delaware | 0.0 /100 | #312 | Tragic 13.8% |
| Blackfeet | 0.0 /100 | #313 | Tragic 13.8% |
| Puget Sound Salish | 0.0 /100 | #314 | Tragic 13.8% |
| Alaskan Athabascans | 0.0 /100 | #315 | Tragic 13.9% |