Scottish vs Immigrants from Belize Female Disability
COMPARE
Scottish
Immigrants from Belize
Female Disability
Female Disability Comparison
Scottish
Immigrants from Belize
13.0%
FEMALE DISABILITY
0.1/ 100
METRIC RATING
278th/ 347
METRIC RANK
12.5%
FEMALE DISABILITY
7.0/ 100
METRIC RATING
230th/ 347
METRIC RANK
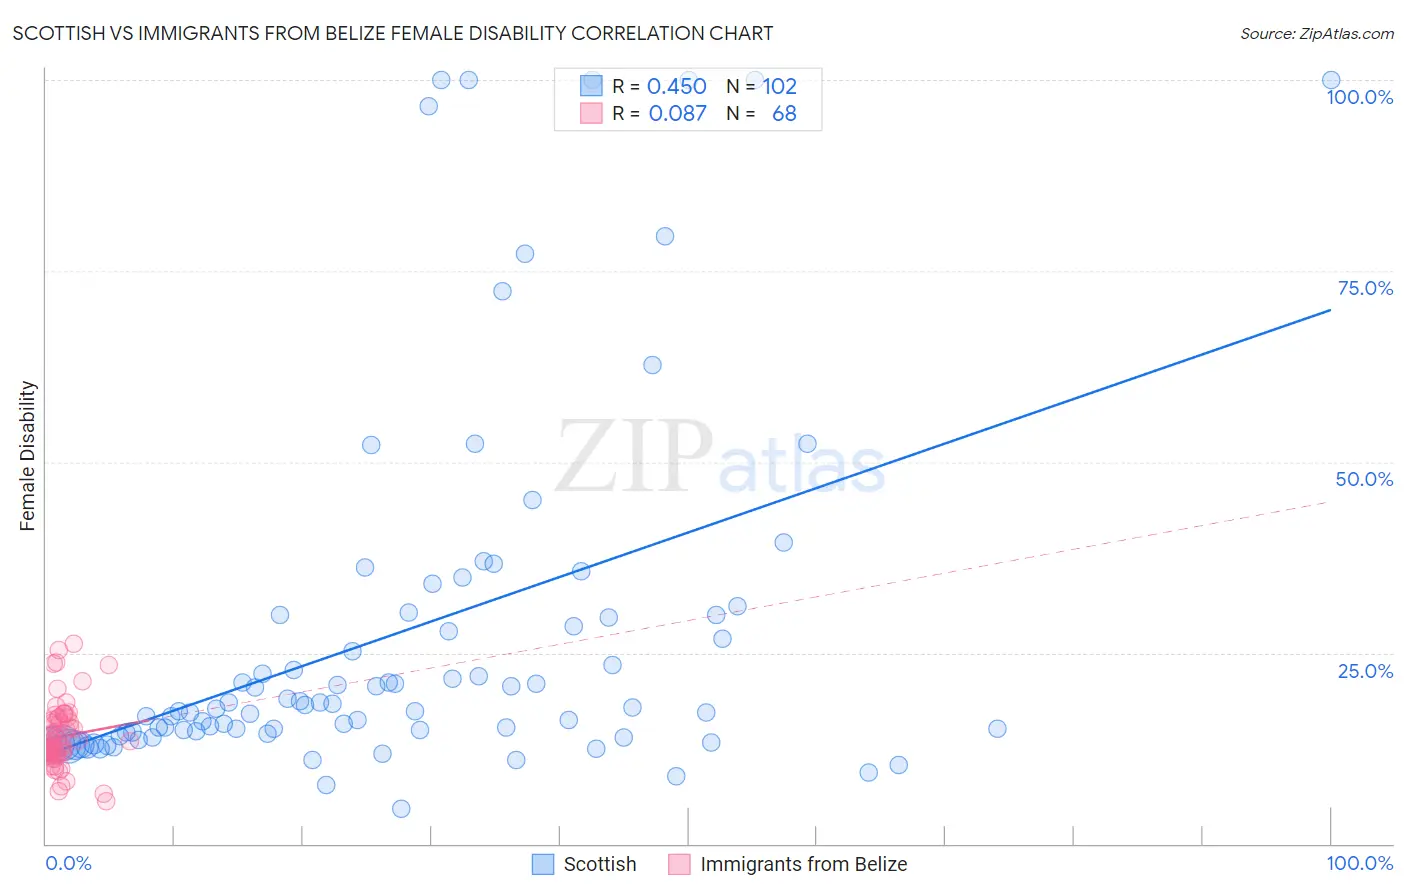
Scottish vs Immigrants from Belize Female Disability Correlation Chart
The statistical analysis conducted on geographies consisting of 566,851,987 people shows a moderate positive correlation between the proportion of Scottish and percentage of females with a disability in the United States with a correlation coefficient (R) of 0.450 and weighted average of 13.0%. Similarly, the statistical analysis conducted on geographies consisting of 130,293,394 people shows a slight positive correlation between the proportion of Immigrants from Belize and percentage of females with a disability in the United States with a correlation coefficient (R) of 0.087 and weighted average of 12.5%, a difference of 4.2%.
Female Disability Correlation Summary
| Measurement | Scottish | Immigrants from Belize |
| Minimum | 4.6% | 5.5% |
| Maximum | 100.0% | 26.2% |
| Range | 95.4% | 20.7% |
| Mean | 27.6% | 14.0% |
| Median | 17.8% | 12.8% |
| Interquartile 25% (IQ1) | 14.4% | 11.8% |
| Interquartile 75% (IQ3) | 30.0% | 16.3% |
| Interquartile Range (IQR) | 15.6% | 4.5% |
| Standard Deviation (Sample) | 24.0% | 4.3% |
| Standard Deviation (Population) | 23.9% | 4.2% |
Similar Demographics by Female Disability
Demographics Similar to Scottish by Female Disability
In terms of female disability, the demographic groups most similar to Scottish are Spanish (13.0%, a difference of 0.080%), Arapaho (13.0%, a difference of 0.24%), Immigrants from Dominica (13.0%, a difference of 0.28%), Irish (13.1%, a difference of 0.33%), and Cheyenne (13.0%, a difference of 0.34%).
| Demographics | Rating | Rank | Female Disability |
| Dutch | 0.2 /100 | #271 | Tragic 12.9% |
| Germans | 0.1 /100 | #272 | Tragic 12.9% |
| Sioux | 0.1 /100 | #273 | Tragic 12.9% |
| Portuguese | 0.1 /100 | #274 | Tragic 13.0% |
| Cheyenne | 0.1 /100 | #275 | Tragic 13.0% |
| Immigrants | Dominica | 0.1 /100 | #276 | Tragic 13.0% |
| Spanish | 0.1 /100 | #277 | Tragic 13.0% |
| Scottish | 0.1 /100 | #278 | Tragic 13.0% |
| Arapaho | 0.1 /100 | #279 | Tragic 13.0% |
| Irish | 0.1 /100 | #280 | Tragic 13.1% |
| U.S. Virgin Islanders | 0.1 /100 | #281 | Tragic 13.1% |
| Welsh | 0.0 /100 | #282 | Tragic 13.1% |
| English | 0.0 /100 | #283 | Tragic 13.1% |
| Hmong | 0.0 /100 | #284 | Tragic 13.1% |
| Bangladeshis | 0.0 /100 | #285 | Tragic 13.1% |
Demographics Similar to Immigrants from Belize by Female Disability
In terms of female disability, the demographic groups most similar to Immigrants from Belize are Hungarian (12.5%, a difference of 0.030%), Belgian (12.5%, a difference of 0.070%), Immigrants from Cambodia (12.5%, a difference of 0.11%), Assyrian/Chaldean/Syriac (12.5%, a difference of 0.13%), and Hispanic or Latino (12.5%, a difference of 0.14%).
| Demographics | Rating | Rank | Female Disability |
| Guamanians/Chamorros | 9.5 /100 | #223 | Tragic 12.5% |
| Belizeans | 9.3 /100 | #224 | Tragic 12.5% |
| Poles | 8.4 /100 | #225 | Tragic 12.5% |
| Hispanics or Latinos | 8.0 /100 | #226 | Tragic 12.5% |
| Assyrians/Chaldeans/Syriacs | 8.0 /100 | #227 | Tragic 12.5% |
| Immigrants | Cambodia | 7.8 /100 | #228 | Tragic 12.5% |
| Hungarians | 7.2 /100 | #229 | Tragic 12.5% |
| Immigrants | Belize | 7.0 /100 | #230 | Tragic 12.5% |
| Belgians | 6.5 /100 | #231 | Tragic 12.5% |
| Immigrants | Somalia | 5.9 /100 | #232 | Tragic 12.5% |
| Immigrants | Iraq | 5.3 /100 | #233 | Tragic 12.5% |
| Scandinavians | 5.3 /100 | #234 | Tragic 12.5% |
| Malaysians | 5.0 /100 | #235 | Tragic 12.5% |
| Immigrants | West Indies | 4.4 /100 | #236 | Tragic 12.6% |
| Slavs | 3.8 /100 | #237 | Tragic 12.6% |