Scottish vs Immigrants from Russia Self-Care Disability
COMPARE
Scottish
Immigrants from Russia
Self-Care Disability
Self-Care Disability Comparison
Scottish
Immigrants from Russia
2.5%
SELF-CARE DISABILITY
54.3/ 100
METRIC RATING
170th/ 347
METRIC RANK
2.5%
SELF-CARE DISABILITY
11.0/ 100
METRIC RATING
205th/ 347
METRIC RANK
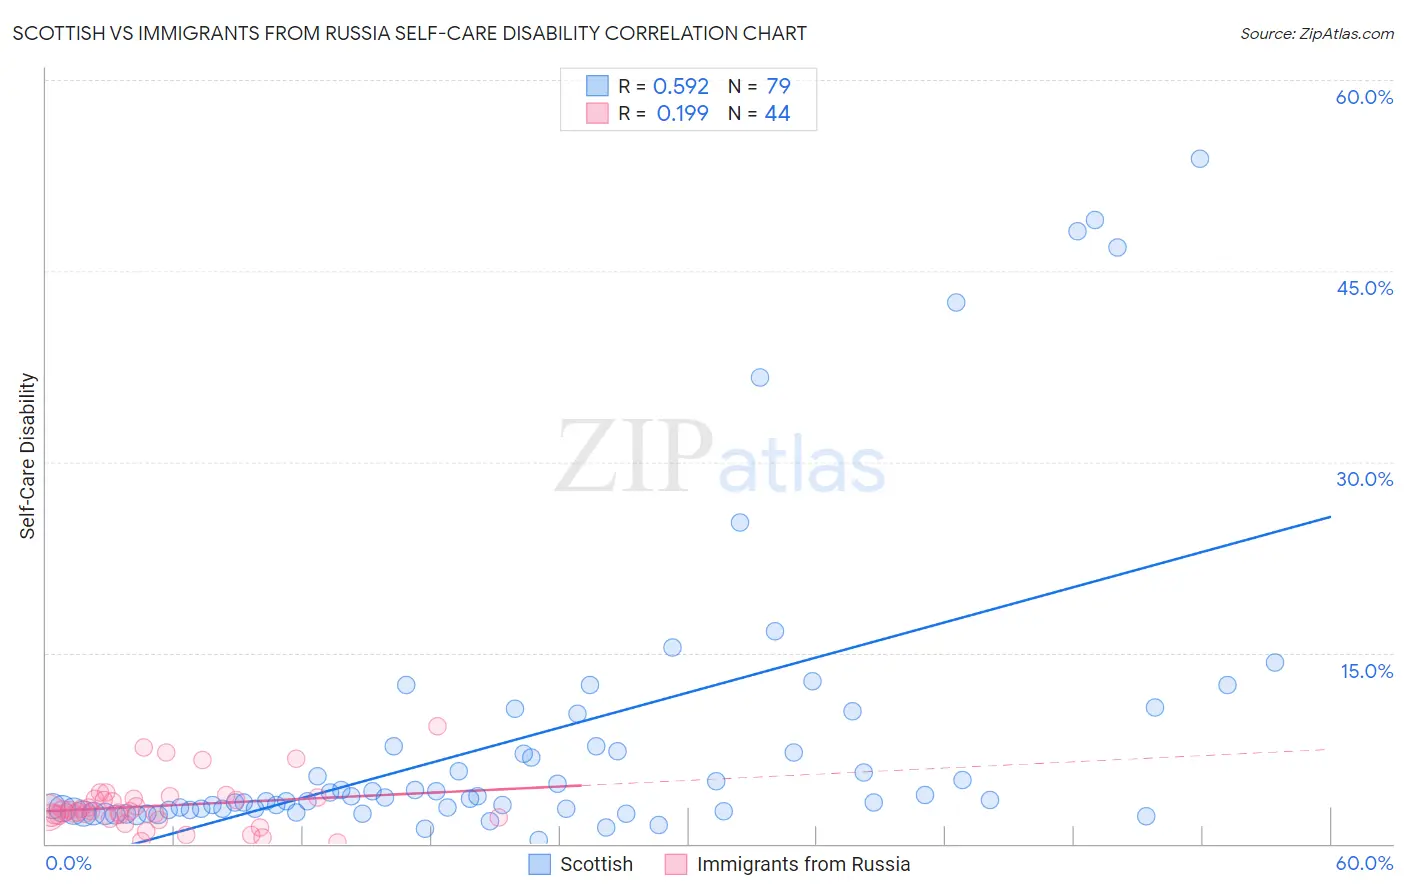
Scottish vs Immigrants from Russia Self-Care Disability Correlation Chart
The statistical analysis conducted on geographies consisting of 564,803,719 people shows a substantial positive correlation between the proportion of Scottish and percentage of population with self-care disability in the United States with a correlation coefficient (R) of 0.592 and weighted average of 2.5%. Similarly, the statistical analysis conducted on geographies consisting of 347,529,839 people shows a poor positive correlation between the proportion of Immigrants from Russia and percentage of population with self-care disability in the United States with a correlation coefficient (R) of 0.199 and weighted average of 2.5%, a difference of 2.7%.
Self-Care Disability Correlation Summary
| Measurement | Scottish | Immigrants from Russia |
| Minimum | 0.29% | 0.094% |
| Maximum | 53.8% | 9.3% |
| Range | 53.6% | 9.2% |
| Mean | 8.3% | 3.0% |
| Median | 3.6% | 2.5% |
| Interquartile 25% (IQ1) | 2.6% | 2.2% |
| Interquartile 75% (IQ3) | 7.7% | 3.5% |
| Interquartile Range (IQR) | 5.0% | 1.4% |
| Standard Deviation (Sample) | 11.8% | 1.9% |
| Standard Deviation (Population) | 11.7% | 1.9% |
Similar Demographics by Self-Care Disability
Demographics Similar to Scottish by Self-Care Disability
In terms of self-care disability, the demographic groups most similar to Scottish are Pennsylvania German (2.5%, a difference of 0.030%), Czechoslovakian (2.5%, a difference of 0.040%), Immigrants from Burma/Myanmar (2.5%, a difference of 0.070%), Immigrants from Somalia (2.5%, a difference of 0.080%), and Ute (2.5%, a difference of 0.14%).
| Demographics | Rating | Rank | Self-Care Disability |
| German Russians | 62.7 /100 | #163 | Good 2.5% |
| Immigrants | Vietnam | 59.3 /100 | #164 | Average 2.5% |
| Syrians | 59.0 /100 | #165 | Average 2.5% |
| Canadians | 58.8 /100 | #166 | Average 2.5% |
| Immigrants | Greece | 57.3 /100 | #167 | Average 2.5% |
| Ute | 57.1 /100 | #168 | Average 2.5% |
| Immigrants | Somalia | 55.9 /100 | #169 | Average 2.5% |
| Scottish | 54.3 /100 | #170 | Average 2.5% |
| Pennsylvania Germans | 53.5 /100 | #171 | Average 2.5% |
| Czechoslovakians | 53.5 /100 | #172 | Average 2.5% |
| Immigrants | Burma/Myanmar | 52.8 /100 | #173 | Average 2.5% |
| Welsh | 50.0 /100 | #174 | Average 2.5% |
| Immigrants | Bosnia and Herzegovina | 49.6 /100 | #175 | Average 2.5% |
| Immigrants | Afghanistan | 47.6 /100 | #176 | Average 2.5% |
| Immigrants | Kazakhstan | 46.7 /100 | #177 | Average 2.5% |
Demographics Similar to Immigrants from Russia by Self-Care Disability
In terms of self-care disability, the demographic groups most similar to Immigrants from Russia are Alaskan Athabascan (2.5%, a difference of 0.080%), Immigrants from Bahamas (2.5%, a difference of 0.10%), French (2.5%, a difference of 0.14%), Immigrants from Lebanon (2.5%, a difference of 0.15%), and Slovak (2.5%, a difference of 0.18%).
| Demographics | Rating | Rank | Self-Care Disability |
| Immigrants | Immigrants | 15.0 /100 | #198 | Poor 2.5% |
| Immigrants | Ghana | 14.7 /100 | #199 | Poor 2.5% |
| Immigrants | Western Africa | 13.3 /100 | #200 | Poor 2.5% |
| Immigrants | South Eastern Asia | 12.9 /100 | #201 | Poor 2.5% |
| Slovaks | 12.6 /100 | #202 | Poor 2.5% |
| Immigrants | Lebanon | 12.4 /100 | #203 | Poor 2.5% |
| Immigrants | Bahamas | 11.9 /100 | #204 | Poor 2.5% |
| Immigrants | Russia | 11.0 /100 | #205 | Poor 2.5% |
| Alaskan Athabascans | 10.4 /100 | #206 | Poor 2.5% |
| French | 9.9 /100 | #207 | Tragic 2.5% |
| Central Americans | 8.7 /100 | #208 | Tragic 2.5% |
| Malaysians | 7.7 /100 | #209 | Tragic 2.5% |
| Panamanians | 6.4 /100 | #210 | Tragic 2.5% |
| Native Hawaiians | 5.1 /100 | #211 | Tragic 2.6% |
| Samoans | 5.1 /100 | #212 | Tragic 2.6% |