Cambodian vs Immigrants from Russia Self-Care Disability
COMPARE
Cambodian
Immigrants from Russia
Self-Care Disability
Self-Care Disability Comparison
Cambodians
Immigrants from Russia
2.2%
SELF-CARE DISABILITY
100.0/ 100
METRIC RATING
23rd/ 347
METRIC RANK
2.5%
SELF-CARE DISABILITY
11.0/ 100
METRIC RATING
205th/ 347
METRIC RANK
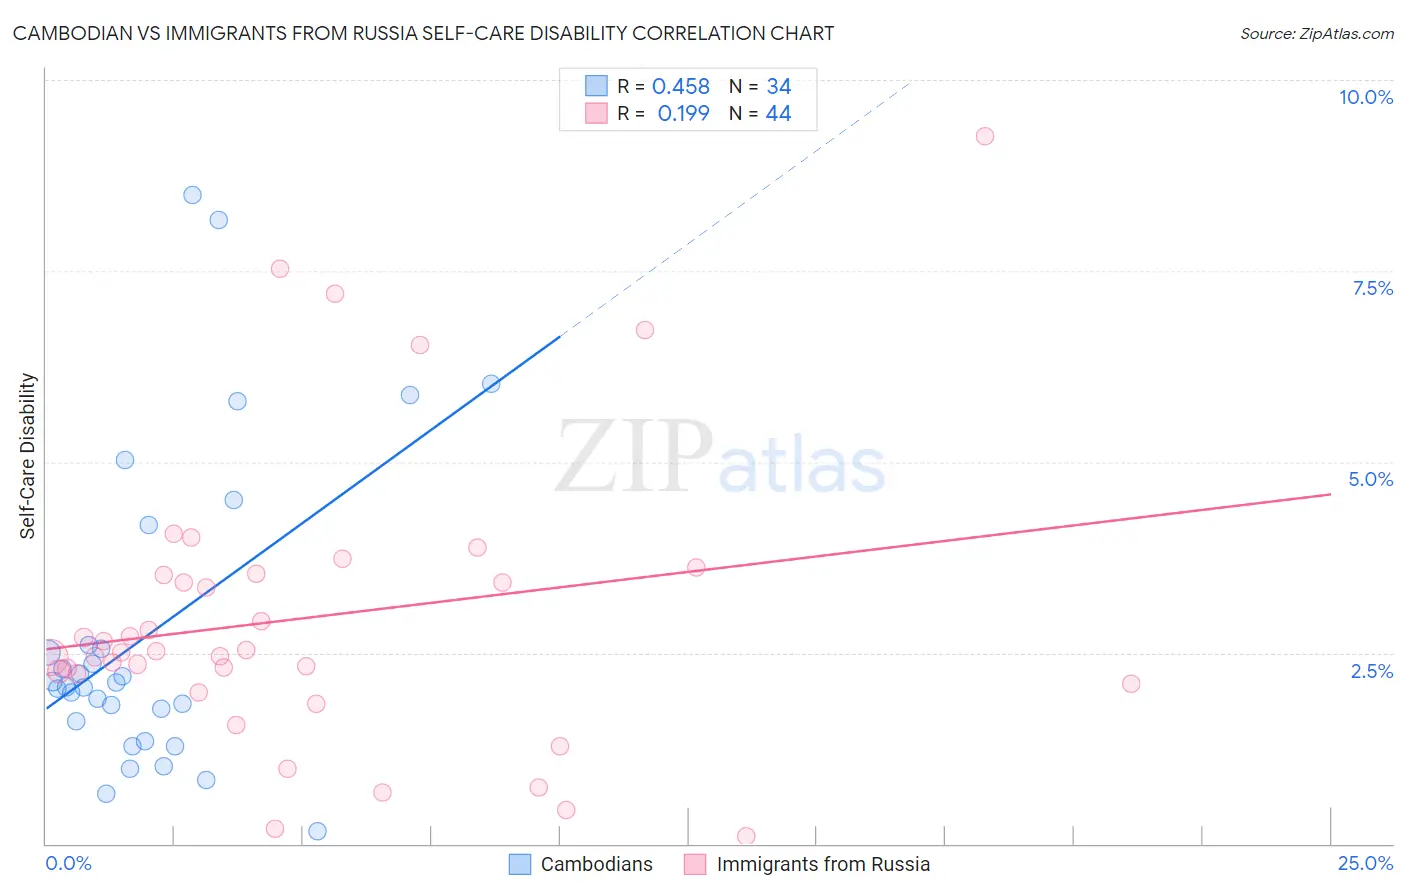
Cambodian vs Immigrants from Russia Self-Care Disability Correlation Chart
The statistical analysis conducted on geographies consisting of 102,460,222 people shows a moderate positive correlation between the proportion of Cambodians and percentage of population with self-care disability in the United States with a correlation coefficient (R) of 0.458 and weighted average of 2.2%. Similarly, the statistical analysis conducted on geographies consisting of 347,529,839 people shows a poor positive correlation between the proportion of Immigrants from Russia and percentage of population with self-care disability in the United States with a correlation coefficient (R) of 0.199 and weighted average of 2.5%, a difference of 13.2%.
Self-Care Disability Correlation Summary
| Measurement | Cambodian | Immigrants from Russia |
| Minimum | 0.17% | 0.094% |
| Maximum | 8.5% | 9.3% |
| Range | 8.3% | 9.2% |
| Mean | 2.8% | 3.0% |
| Median | 2.1% | 2.5% |
| Interquartile 25% (IQ1) | 1.6% | 2.2% |
| Interquartile 75% (IQ3) | 2.6% | 3.5% |
| Interquartile Range (IQR) | 1.00% | 1.4% |
| Standard Deviation (Sample) | 2.0% | 1.9% |
| Standard Deviation (Population) | 2.0% | 1.9% |
Similar Demographics by Self-Care Disability
Demographics Similar to Cambodians by Self-Care Disability
In terms of self-care disability, the demographic groups most similar to Cambodians are Immigrants from Venezuela (2.2%, a difference of 0.21%), Bulgarian (2.2%, a difference of 0.25%), Cypriot (2.2%, a difference of 0.30%), Turkish (2.2%, a difference of 0.41%), and Immigrants from Sri Lanka (2.2%, a difference of 0.48%).
| Demographics | Rating | Rank | Self-Care Disability |
| Immigrants | Kuwait | 100.0 /100 | #16 | Exceptional 2.2% |
| Immigrants | Saudi Arabia | 100.0 /100 | #17 | Exceptional 2.2% |
| Immigrants | Taiwan | 100.0 /100 | #18 | Exceptional 2.2% |
| Immigrants | Eritrea | 100.0 /100 | #19 | Exceptional 2.2% |
| Tongans | 100.0 /100 | #20 | Exceptional 2.2% |
| Bulgarians | 100.0 /100 | #21 | Exceptional 2.2% |
| Immigrants | Venezuela | 100.0 /100 | #22 | Exceptional 2.2% |
| Cambodians | 100.0 /100 | #23 | Exceptional 2.2% |
| Cypriots | 100.0 /100 | #24 | Exceptional 2.2% |
| Turks | 100.0 /100 | #25 | Exceptional 2.2% |
| Immigrants | Sri Lanka | 99.9 /100 | #26 | Exceptional 2.2% |
| Venezuelans | 99.9 /100 | #27 | Exceptional 2.2% |
| Inupiat | 99.9 /100 | #28 | Exceptional 2.2% |
| Immigrants | Zimbabwe | 99.9 /100 | #29 | Exceptional 2.3% |
| Paraguayans | 99.9 /100 | #30 | Exceptional 2.3% |
Demographics Similar to Immigrants from Russia by Self-Care Disability
In terms of self-care disability, the demographic groups most similar to Immigrants from Russia are Alaskan Athabascan (2.5%, a difference of 0.080%), Immigrants from Bahamas (2.5%, a difference of 0.10%), French (2.5%, a difference of 0.14%), Immigrants from Lebanon (2.5%, a difference of 0.15%), and Slovak (2.5%, a difference of 0.18%).
| Demographics | Rating | Rank | Self-Care Disability |
| Immigrants | Immigrants | 15.0 /100 | #198 | Poor 2.5% |
| Immigrants | Ghana | 14.7 /100 | #199 | Poor 2.5% |
| Immigrants | Western Africa | 13.3 /100 | #200 | Poor 2.5% |
| Immigrants | South Eastern Asia | 12.9 /100 | #201 | Poor 2.5% |
| Slovaks | 12.6 /100 | #202 | Poor 2.5% |
| Immigrants | Lebanon | 12.4 /100 | #203 | Poor 2.5% |
| Immigrants | Bahamas | 11.9 /100 | #204 | Poor 2.5% |
| Immigrants | Russia | 11.0 /100 | #205 | Poor 2.5% |
| Alaskan Athabascans | 10.4 /100 | #206 | Poor 2.5% |
| French | 9.9 /100 | #207 | Tragic 2.5% |
| Central Americans | 8.7 /100 | #208 | Tragic 2.5% |
| Malaysians | 7.7 /100 | #209 | Tragic 2.5% |
| Panamanians | 6.4 /100 | #210 | Tragic 2.5% |
| Native Hawaiians | 5.1 /100 | #211 | Tragic 2.6% |
| Samoans | 5.1 /100 | #212 | Tragic 2.6% |