Scottish vs Yugoslavian Self-Care Disability
COMPARE
Scottish
Yugoslavian
Self-Care Disability
Self-Care Disability Comparison
Scottish
Yugoslavians
2.5%
SELF-CARE DISABILITY
54.3/ 100
METRIC RATING
170th/ 347
METRIC RANK
2.5%
SELF-CARE DISABILITY
36.1/ 100
METRIC RATING
184th/ 347
METRIC RANK
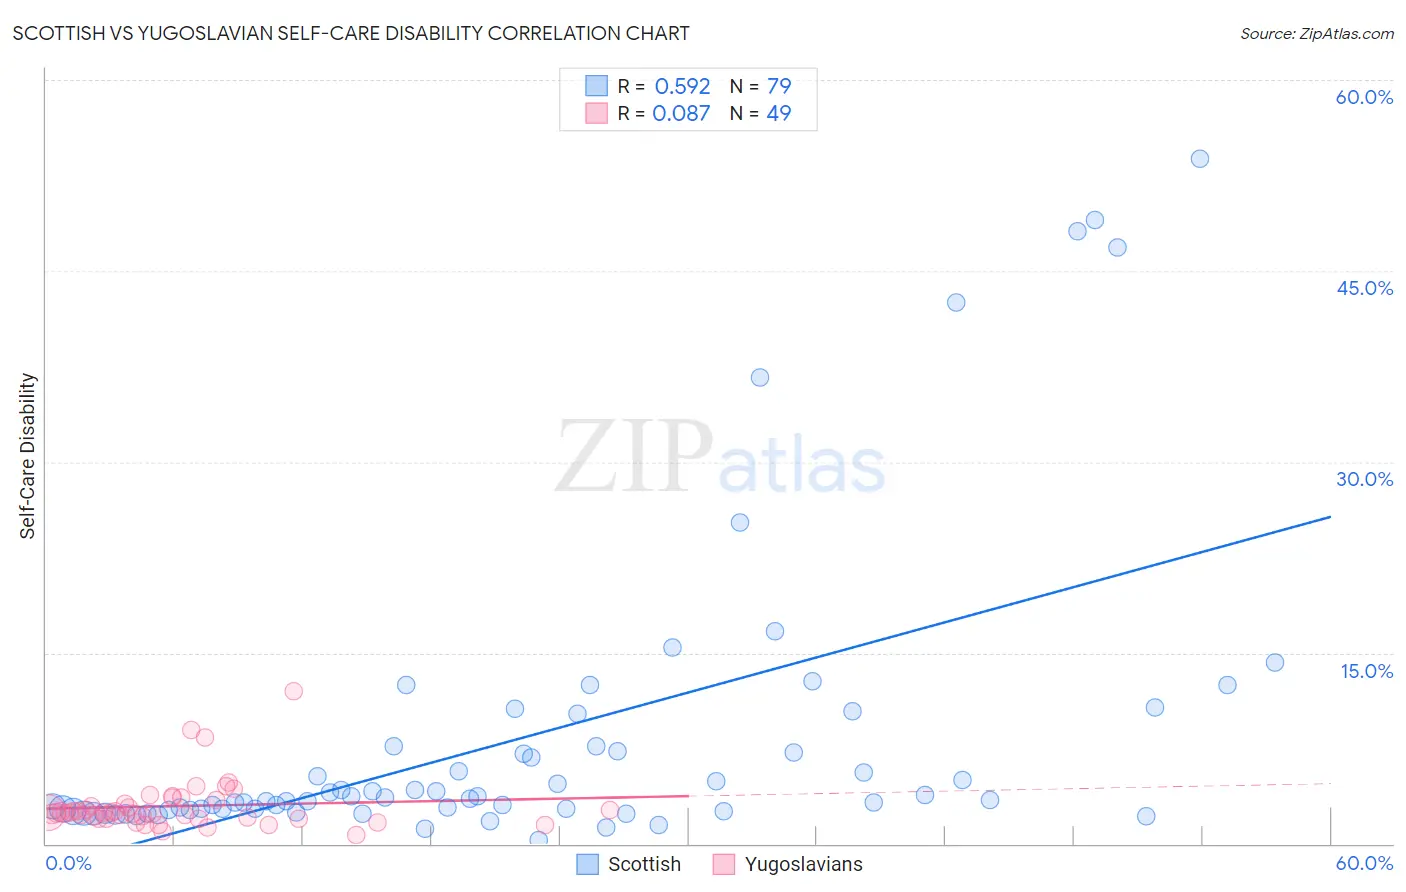
Scottish vs Yugoslavian Self-Care Disability Correlation Chart
The statistical analysis conducted on geographies consisting of 564,803,719 people shows a substantial positive correlation between the proportion of Scottish and percentage of population with self-care disability in the United States with a correlation coefficient (R) of 0.592 and weighted average of 2.5%. Similarly, the statistical analysis conducted on geographies consisting of 285,516,060 people shows a slight positive correlation between the proportion of Yugoslavians and percentage of population with self-care disability in the United States with a correlation coefficient (R) of 0.087 and weighted average of 2.5%, a difference of 0.88%.
Self-Care Disability Correlation Summary
| Measurement | Scottish | Yugoslavian |
| Minimum | 0.29% | 0.70% |
| Maximum | 53.8% | 11.9% |
| Range | 53.6% | 11.2% |
| Mean | 8.3% | 3.0% |
| Median | 3.6% | 2.5% |
| Interquartile 25% (IQ1) | 2.6% | 2.0% |
| Interquartile 75% (IQ3) | 7.7% | 3.3% |
| Interquartile Range (IQR) | 5.0% | 1.3% |
| Standard Deviation (Sample) | 11.8% | 2.0% |
| Standard Deviation (Population) | 11.7% | 2.0% |
Demographics Similar to Scottish and Yugoslavians by Self-Care Disability
In terms of self-care disability, the demographic groups most similar to Scottish are Pennsylvania German (2.5%, a difference of 0.030%), Czechoslovakian (2.5%, a difference of 0.040%), Immigrants from Burma/Myanmar (2.5%, a difference of 0.070%), Immigrants from Somalia (2.5%, a difference of 0.080%), and Ute (2.5%, a difference of 0.14%). Similarly, the demographic groups most similar to Yugoslavians are Salvadoran (2.5%, a difference of 0.020%), Maltese (2.5%, a difference of 0.070%), Slavic (2.5%, a difference of 0.090%), Immigrants from El Salvador (2.5%, a difference of 0.17%), and Ghanaian (2.5%, a difference of 0.21%).
| Demographics | Rating | Rank | Self-Care Disability |
| Immigrants | Greece | 57.3 /100 | #167 | Average 2.5% |
| Ute | 57.1 /100 | #168 | Average 2.5% |
| Immigrants | Somalia | 55.9 /100 | #169 | Average 2.5% |
| Scottish | 54.3 /100 | #170 | Average 2.5% |
| Pennsylvania Germans | 53.5 /100 | #171 | Average 2.5% |
| Czechoslovakians | 53.5 /100 | #172 | Average 2.5% |
| Immigrants | Burma/Myanmar | 52.8 /100 | #173 | Average 2.5% |
| Welsh | 50.0 /100 | #174 | Average 2.5% |
| Immigrants | Bosnia and Herzegovina | 49.6 /100 | #175 | Average 2.5% |
| Immigrants | Afghanistan | 47.6 /100 | #176 | Average 2.5% |
| Immigrants | Kazakhstan | 46.7 /100 | #177 | Average 2.5% |
| English | 46.2 /100 | #178 | Average 2.5% |
| Hungarians | 45.5 /100 | #179 | Average 2.5% |
| Indonesians | 41.2 /100 | #180 | Average 2.5% |
| Ghanaians | 40.4 /100 | #181 | Average 2.5% |
| Maltese | 37.5 /100 | #182 | Fair 2.5% |
| Salvadorans | 36.4 /100 | #183 | Fair 2.5% |
| Yugoslavians | 36.1 /100 | #184 | Fair 2.5% |
| Slavs | 34.3 /100 | #185 | Fair 2.5% |
| Immigrants | El Salvador | 33.0 /100 | #186 | Fair 2.5% |
| Irish | 28.7 /100 | #187 | Fair 2.5% |