Scottish vs Kiowa Self-Care Disability
COMPARE
Scottish
Kiowa
Self-Care Disability
Self-Care Disability Comparison
Scottish
Kiowa
2.5%
SELF-CARE DISABILITY
54.3/ 100
METRIC RATING
170th/ 347
METRIC RANK
3.0%
SELF-CARE DISABILITY
0.0/ 100
METRIC RATING
332nd/ 347
METRIC RANK
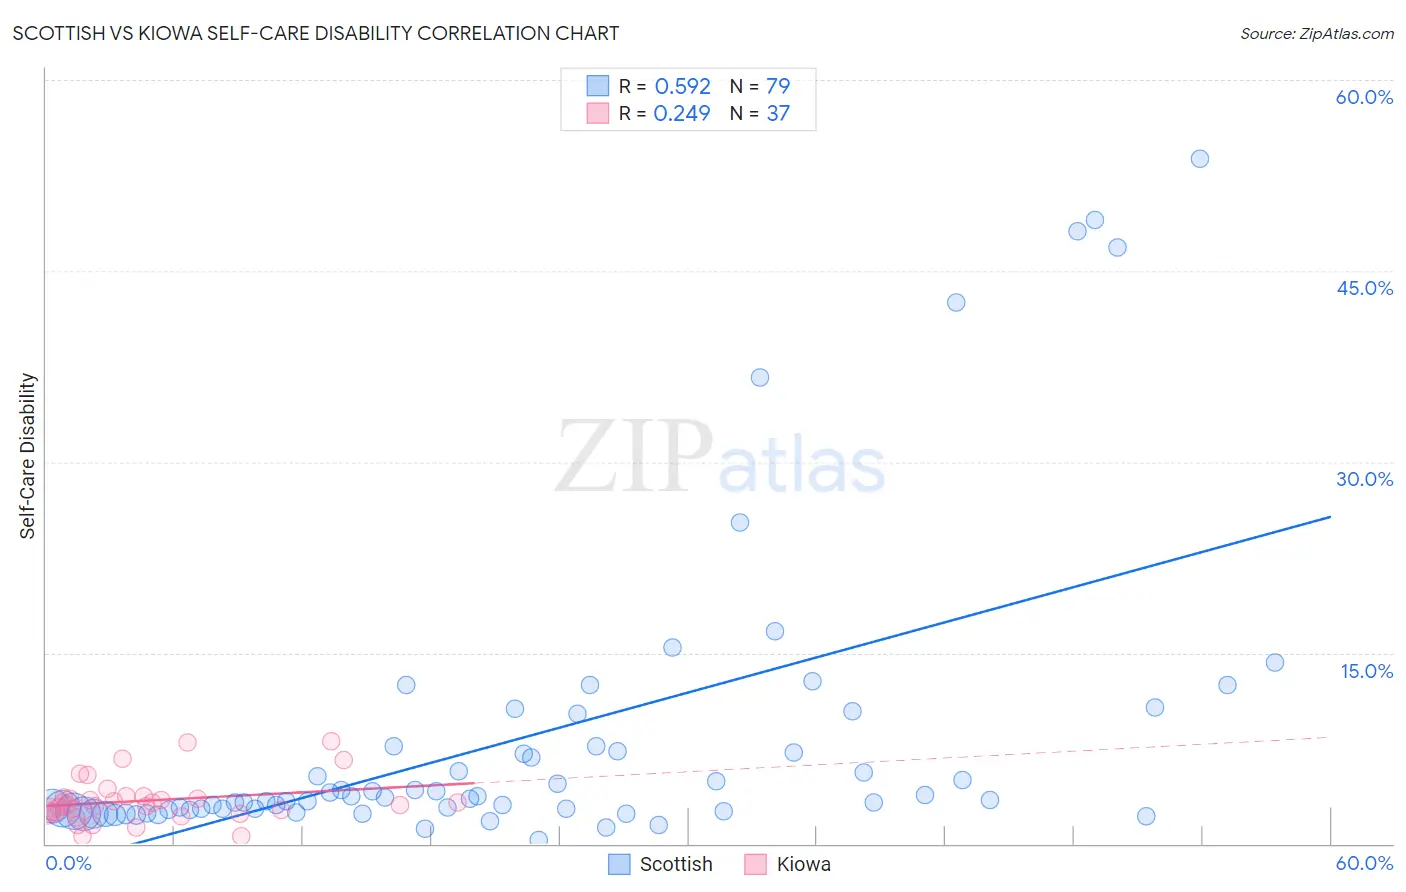
Scottish vs Kiowa Self-Care Disability Correlation Chart
The statistical analysis conducted on geographies consisting of 564,803,719 people shows a substantial positive correlation between the proportion of Scottish and percentage of population with self-care disability in the United States with a correlation coefficient (R) of 0.592 and weighted average of 2.5%. Similarly, the statistical analysis conducted on geographies consisting of 56,085,215 people shows a weak positive correlation between the proportion of Kiowa and percentage of population with self-care disability in the United States with a correlation coefficient (R) of 0.249 and weighted average of 3.0%, a difference of 20.9%.
Self-Care Disability Correlation Summary
| Measurement | Scottish | Kiowa |
| Minimum | 0.29% | 0.57% |
| Maximum | 53.8% | 8.0% |
| Range | 53.6% | 7.4% |
| Mean | 8.3% | 3.4% |
| Median | 3.6% | 3.1% |
| Interquartile 25% (IQ1) | 2.6% | 2.5% |
| Interquartile 75% (IQ3) | 7.7% | 3.7% |
| Interquartile Range (IQR) | 5.0% | 1.2% |
| Standard Deviation (Sample) | 11.8% | 1.7% |
| Standard Deviation (Population) | 11.7% | 1.7% |
Similar Demographics by Self-Care Disability
Demographics Similar to Scottish by Self-Care Disability
In terms of self-care disability, the demographic groups most similar to Scottish are Pennsylvania German (2.5%, a difference of 0.030%), Czechoslovakian (2.5%, a difference of 0.040%), Immigrants from Burma/Myanmar (2.5%, a difference of 0.070%), Immigrants from Somalia (2.5%, a difference of 0.080%), and Ute (2.5%, a difference of 0.14%).
| Demographics | Rating | Rank | Self-Care Disability |
| German Russians | 62.7 /100 | #163 | Good 2.5% |
| Immigrants | Vietnam | 59.3 /100 | #164 | Average 2.5% |
| Syrians | 59.0 /100 | #165 | Average 2.5% |
| Canadians | 58.8 /100 | #166 | Average 2.5% |
| Immigrants | Greece | 57.3 /100 | #167 | Average 2.5% |
| Ute | 57.1 /100 | #168 | Average 2.5% |
| Immigrants | Somalia | 55.9 /100 | #169 | Average 2.5% |
| Scottish | 54.3 /100 | #170 | Average 2.5% |
| Pennsylvania Germans | 53.5 /100 | #171 | Average 2.5% |
| Czechoslovakians | 53.5 /100 | #172 | Average 2.5% |
| Immigrants | Burma/Myanmar | 52.8 /100 | #173 | Average 2.5% |
| Welsh | 50.0 /100 | #174 | Average 2.5% |
| Immigrants | Bosnia and Herzegovina | 49.6 /100 | #175 | Average 2.5% |
| Immigrants | Afghanistan | 47.6 /100 | #176 | Average 2.5% |
| Immigrants | Kazakhstan | 46.7 /100 | #177 | Average 2.5% |
Demographics Similar to Kiowa by Self-Care Disability
In terms of self-care disability, the demographic groups most similar to Kiowa are Dutch West Indian (3.0%, a difference of 0.23%), Houma (3.0%, a difference of 0.30%), Immigrants from the Azores (3.0%, a difference of 0.35%), Lumbee (3.0%, a difference of 0.36%), and Nepalese (3.0%, a difference of 0.47%).
| Demographics | Rating | Rank | Self-Care Disability |
| Immigrants | Uzbekistan | 0.0 /100 | #325 | Tragic 2.9% |
| Paiute | 0.0 /100 | #326 | Tragic 2.9% |
| Blacks/African Americans | 0.0 /100 | #327 | Tragic 2.9% |
| Hopi | 0.0 /100 | #328 | Tragic 2.9% |
| Cajuns | 0.0 /100 | #329 | Tragic 2.9% |
| Nepalese | 0.0 /100 | #330 | Tragic 3.0% |
| Lumbee | 0.0 /100 | #331 | Tragic 3.0% |
| Kiowa | 0.0 /100 | #332 | Tragic 3.0% |
| Dutch West Indians | 0.0 /100 | #333 | Tragic 3.0% |
| Houma | 0.0 /100 | #334 | Tragic 3.0% |
| Immigrants | Azores | 0.0 /100 | #335 | Tragic 3.0% |
| Immigrants | Yemen | 0.0 /100 | #336 | Tragic 3.0% |
| Choctaw | 0.0 /100 | #337 | Tragic 3.0% |
| Cape Verdeans | 0.0 /100 | #338 | Tragic 3.0% |
| Immigrants | Dominican Republic | 0.0 /100 | #339 | Tragic 3.0% |