Scottish vs Immigrants from Russia Single Father Poverty
COMPARE
Scottish
Immigrants from Russia
Single Father Poverty
Single Father Poverty Comparison
Scottish
Immigrants from Russia
17.7%
SINGLE FATHER POVERTY
0.0/ 100
METRIC RATING
280th/ 347
METRIC RANK
15.5%
SINGLE FATHER POVERTY
99.0/ 100
METRIC RATING
86th/ 347
METRIC RANK
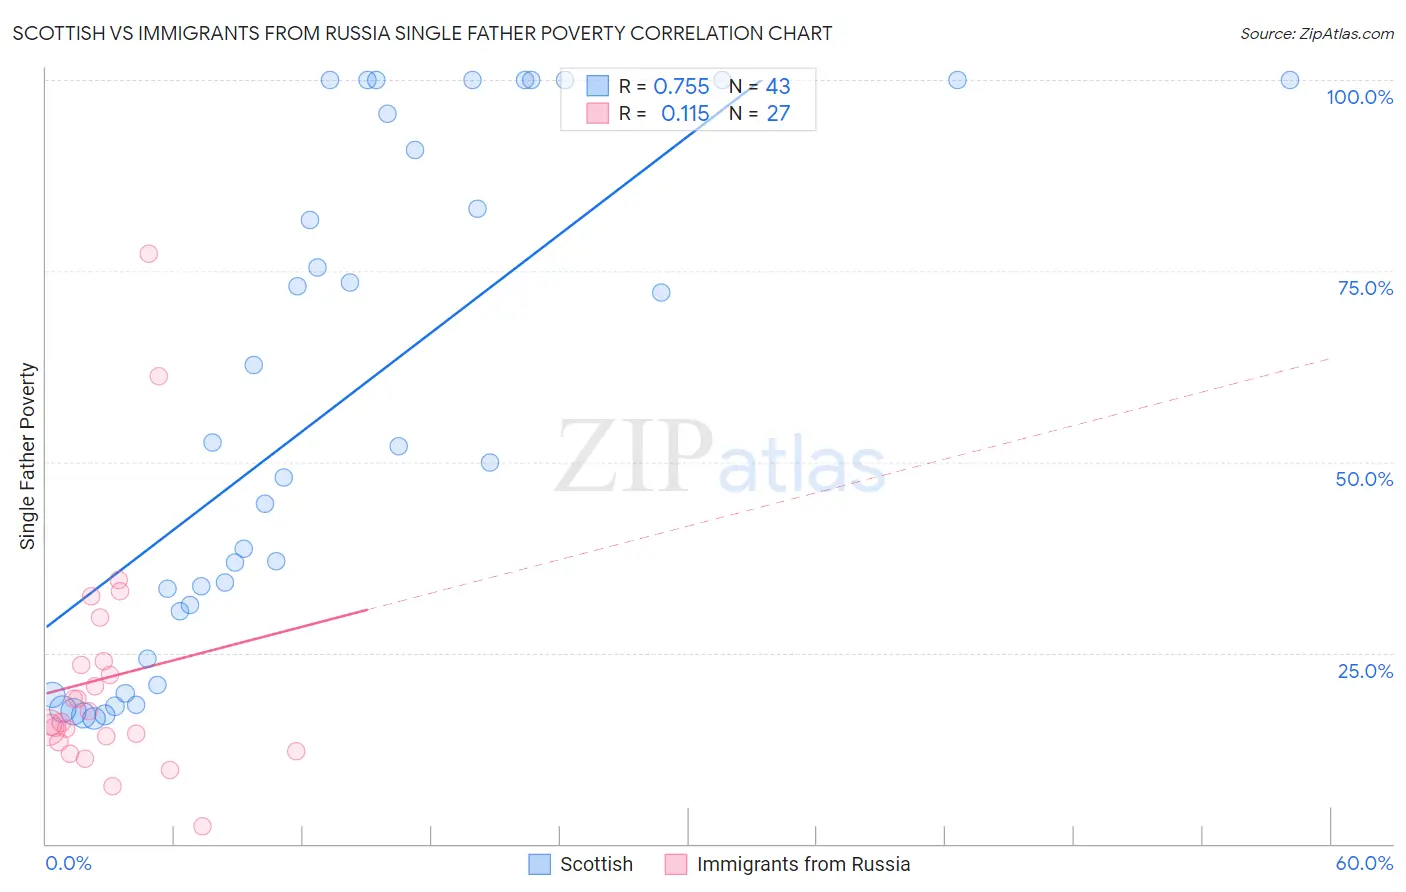
Scottish vs Immigrants from Russia Single Father Poverty Correlation Chart
The statistical analysis conducted on geographies consisting of 405,098,352 people shows a strong positive correlation between the proportion of Scottish and poverty level among single fathers in the United States with a correlation coefficient (R) of 0.755 and weighted average of 17.7%. Similarly, the statistical analysis conducted on geographies consisting of 273,488,054 people shows a poor positive correlation between the proportion of Immigrants from Russia and poverty level among single fathers in the United States with a correlation coefficient (R) of 0.115 and weighted average of 15.5%, a difference of 14.8%.
Single Father Poverty Correlation Summary
| Measurement | Scottish | Immigrants from Russia |
| Minimum | 16.4% | 2.4% |
| Maximum | 100.0% | 77.3% |
| Range | 83.6% | 74.9% |
| Mean | 56.6% | 21.7% |
| Median | 50.0% | 15.9% |
| Interquartile 25% (IQ1) | 24.3% | 13.3% |
| Interquartile 75% (IQ3) | 95.6% | 23.9% |
| Interquartile Range (IQR) | 71.3% | 10.6% |
| Standard Deviation (Sample) | 32.4% | 15.9% |
| Standard Deviation (Population) | 32.1% | 15.6% |
Similar Demographics by Single Father Poverty
Demographics Similar to Scottish by Single Father Poverty
In terms of single father poverty, the demographic groups most similar to Scottish are Iroquois (17.7%, a difference of 0.050%), German (17.7%, a difference of 0.19%), Lebanese (17.7%, a difference of 0.20%), English (17.8%, a difference of 0.32%), and Dutch (17.8%, a difference of 0.32%).
| Demographics | Rating | Rank | Single Father Poverty |
| Italians | 0.1 /100 | #273 | Tragic 17.5% |
| Macedonians | 0.1 /100 | #274 | Tragic 17.7% |
| British West Indians | 0.0 /100 | #275 | Tragic 17.7% |
| German Russians | 0.0 /100 | #276 | Tragic 17.7% |
| Lebanese | 0.0 /100 | #277 | Tragic 17.7% |
| Germans | 0.0 /100 | #278 | Tragic 17.7% |
| Iroquois | 0.0 /100 | #279 | Tragic 17.7% |
| Scottish | 0.0 /100 | #280 | Tragic 17.7% |
| English | 0.0 /100 | #281 | Tragic 17.8% |
| Dutch | 0.0 /100 | #282 | Tragic 17.8% |
| Alsatians | 0.0 /100 | #283 | Tragic 17.8% |
| Welsh | 0.0 /100 | #284 | Tragic 17.8% |
| Immigrants | Lebanon | 0.0 /100 | #285 | Tragic 17.9% |
| Immigrants | North Macedonia | 0.0 /100 | #286 | Tragic 17.9% |
| Carpatho Rusyns | 0.0 /100 | #287 | Tragic 18.0% |
Demographics Similar to Immigrants from Russia by Single Father Poverty
In terms of single father poverty, the demographic groups most similar to Immigrants from Russia are Brazilian (15.5%, a difference of 0.0%), Burmese (15.5%, a difference of 0.040%), Immigrants from Korea (15.5%, a difference of 0.10%), Immigrants from Oceania (15.4%, a difference of 0.12%), and Peruvian (15.4%, a difference of 0.24%).
| Demographics | Rating | Rank | Single Father Poverty |
| Immigrants | Northern Africa | 99.5 /100 | #79 | Exceptional 15.3% |
| Armenians | 99.4 /100 | #80 | Exceptional 15.4% |
| Immigrants | Congo | 99.4 /100 | #81 | Exceptional 15.4% |
| Immigrants | Ukraine | 99.4 /100 | #82 | Exceptional 15.4% |
| Chinese | 99.3 /100 | #83 | Exceptional 15.4% |
| Peruvians | 99.2 /100 | #84 | Exceptional 15.4% |
| Immigrants | Oceania | 99.1 /100 | #85 | Exceptional 15.4% |
| Immigrants | Russia | 99.0 /100 | #86 | Exceptional 15.5% |
| Brazilians | 99.0 /100 | #87 | Exceptional 15.5% |
| Burmese | 99.0 /100 | #88 | Exceptional 15.5% |
| Immigrants | Korea | 99.0 /100 | #89 | Exceptional 15.5% |
| Mexican American Indians | 98.7 /100 | #90 | Exceptional 15.5% |
| Immigrants | Romania | 98.6 /100 | #91 | Exceptional 15.5% |
| Immigrants | Serbia | 98.5 /100 | #92 | Exceptional 15.5% |
| Basques | 98.4 /100 | #93 | Exceptional 15.5% |