Scottish vs Immigrants from Venezuela Ambulatory Disability
COMPARE
Scottish
Immigrants from Venezuela
Ambulatory Disability
Ambulatory Disability Comparison
Scottish
Immigrants from Venezuela
6.5%
AMBULATORY DISABILITY
0.7/ 100
METRIC RATING
253rd/ 347
METRIC RANK
5.4%
AMBULATORY DISABILITY
100.0/ 100
METRIC RATING
31st/ 347
METRIC RANK
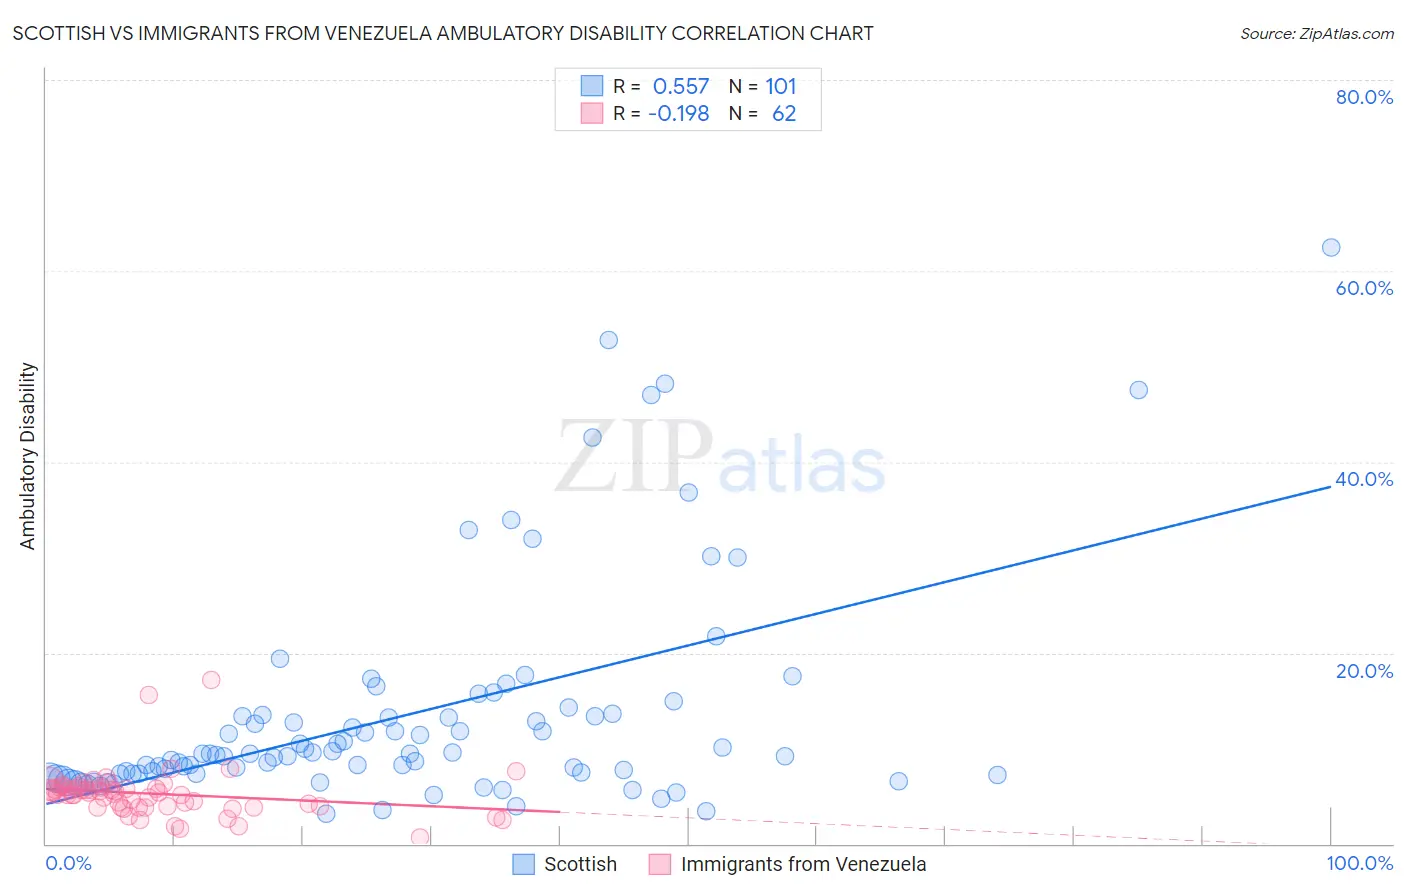
Scottish vs Immigrants from Venezuela Ambulatory Disability Correlation Chart
The statistical analysis conducted on geographies consisting of 566,616,487 people shows a substantial positive correlation between the proportion of Scottish and percentage of population with ambulatory disability in the United States with a correlation coefficient (R) of 0.557 and weighted average of 6.5%. Similarly, the statistical analysis conducted on geographies consisting of 287,823,079 people shows a poor negative correlation between the proportion of Immigrants from Venezuela and percentage of population with ambulatory disability in the United States with a correlation coefficient (R) of -0.198 and weighted average of 5.4%, a difference of 19.6%.
Ambulatory Disability Correlation Summary
| Measurement | Scottish | Immigrants from Venezuela |
| Minimum | 3.1% | 0.63% |
| Maximum | 62.5% | 17.1% |
| Range | 59.4% | 16.5% |
| Mean | 13.4% | 5.2% |
| Median | 9.4% | 5.3% |
| Interquartile 25% (IQ1) | 7.3% | 3.8% |
| Interquartile 75% (IQ3) | 13.4% | 5.8% |
| Interquartile Range (IQR) | 6.1% | 2.0% |
| Standard Deviation (Sample) | 11.4% | 2.6% |
| Standard Deviation (Population) | 11.4% | 2.5% |
Similar Demographics by Ambulatory Disability
Demographics Similar to Scottish by Ambulatory Disability
In terms of ambulatory disability, the demographic groups most similar to Scottish are Immigrants from Bahamas (6.5%, a difference of 0.050%), Belizean (6.5%, a difference of 0.16%), Welsh (6.5%, a difference of 0.23%), Hawaiian (6.5%, a difference of 0.25%), and Immigrants from Uzbekistan (6.5%, a difference of 0.30%).
| Demographics | Rating | Rank | Ambulatory Disability |
| Armenians | 1.5 /100 | #246 | Tragic 6.5% |
| Immigrants | Cuba | 1.4 /100 | #247 | Tragic 6.5% |
| Immigrants | Portugal | 1.4 /100 | #248 | Tragic 6.5% |
| Native Hawaiians | 1.1 /100 | #249 | Tragic 6.5% |
| Chinese | 1.0 /100 | #250 | Tragic 6.5% |
| Hawaiians | 0.9 /100 | #251 | Tragic 6.5% |
| Immigrants | Bahamas | 0.8 /100 | #252 | Tragic 6.5% |
| Scottish | 0.7 /100 | #253 | Tragic 6.5% |
| Belizeans | 0.7 /100 | #254 | Tragic 6.5% |
| Welsh | 0.6 /100 | #255 | Tragic 6.5% |
| Immigrants | Uzbekistan | 0.6 /100 | #256 | Tragic 6.5% |
| Bermudans | 0.5 /100 | #257 | Tragic 6.5% |
| Spanish American Indians | 0.5 /100 | #258 | Tragic 6.5% |
| Aleuts | 0.4 /100 | #259 | Tragic 6.6% |
| Immigrants | Belize | 0.4 /100 | #260 | Tragic 6.6% |
Demographics Similar to Immigrants from Venezuela by Ambulatory Disability
In terms of ambulatory disability, the demographic groups most similar to Immigrants from Venezuela are Immigrants from Turkey (5.4%, a difference of 0.020%), Immigrants from Australia (5.5%, a difference of 0.17%), Immigrants from Pakistan (5.5%, a difference of 0.29%), Immigrants from Asia (5.5%, a difference of 0.44%), and Afghan (5.5%, a difference of 0.49%).
| Demographics | Rating | Rank | Ambulatory Disability |
| Immigrants | Saudi Arabia | 100.0 /100 | #24 | Exceptional 5.4% |
| Zimbabweans | 100.0 /100 | #25 | Exceptional 5.4% |
| Immigrants | Nepal | 100.0 /100 | #26 | Exceptional 5.4% |
| Asians | 100.0 /100 | #27 | Exceptional 5.4% |
| Cambodians | 100.0 /100 | #28 | Exceptional 5.4% |
| Immigrants | Iran | 100.0 /100 | #29 | Exceptional 5.4% |
| Immigrants | Turkey | 100.0 /100 | #30 | Exceptional 5.4% |
| Immigrants | Venezuela | 100.0 /100 | #31 | Exceptional 5.4% |
| Immigrants | Australia | 100.0 /100 | #32 | Exceptional 5.5% |
| Immigrants | Pakistan | 100.0 /100 | #33 | Exceptional 5.5% |
| Immigrants | Asia | 100.0 /100 | #34 | Exceptional 5.5% |
| Afghans | 100.0 /100 | #35 | Exceptional 5.5% |
| Immigrants | Malaysia | 100.0 /100 | #36 | Exceptional 5.5% |
| Turks | 100.0 /100 | #37 | Exceptional 5.5% |
| Cypriots | 100.0 /100 | #38 | Exceptional 5.5% |