Assyrian/Chaldean/Syriac vs Yugoslavian Disability Age 35 to 64
COMPARE
Assyrian/Chaldean/Syriac
Yugoslavian
Disability Age 35 to 64
Disability Age 35 to 64 Comparison
Assyrians/Chaldeans/Syriacs
Yugoslavians
10.5%
DISABILITY AGE 35 TO 64
96.8/ 100
METRIC RATING
112th/ 347
METRIC RANK
11.7%
DISABILITY AGE 35 TO 64
11.6/ 100
METRIC RATING
213th/ 347
METRIC RANK
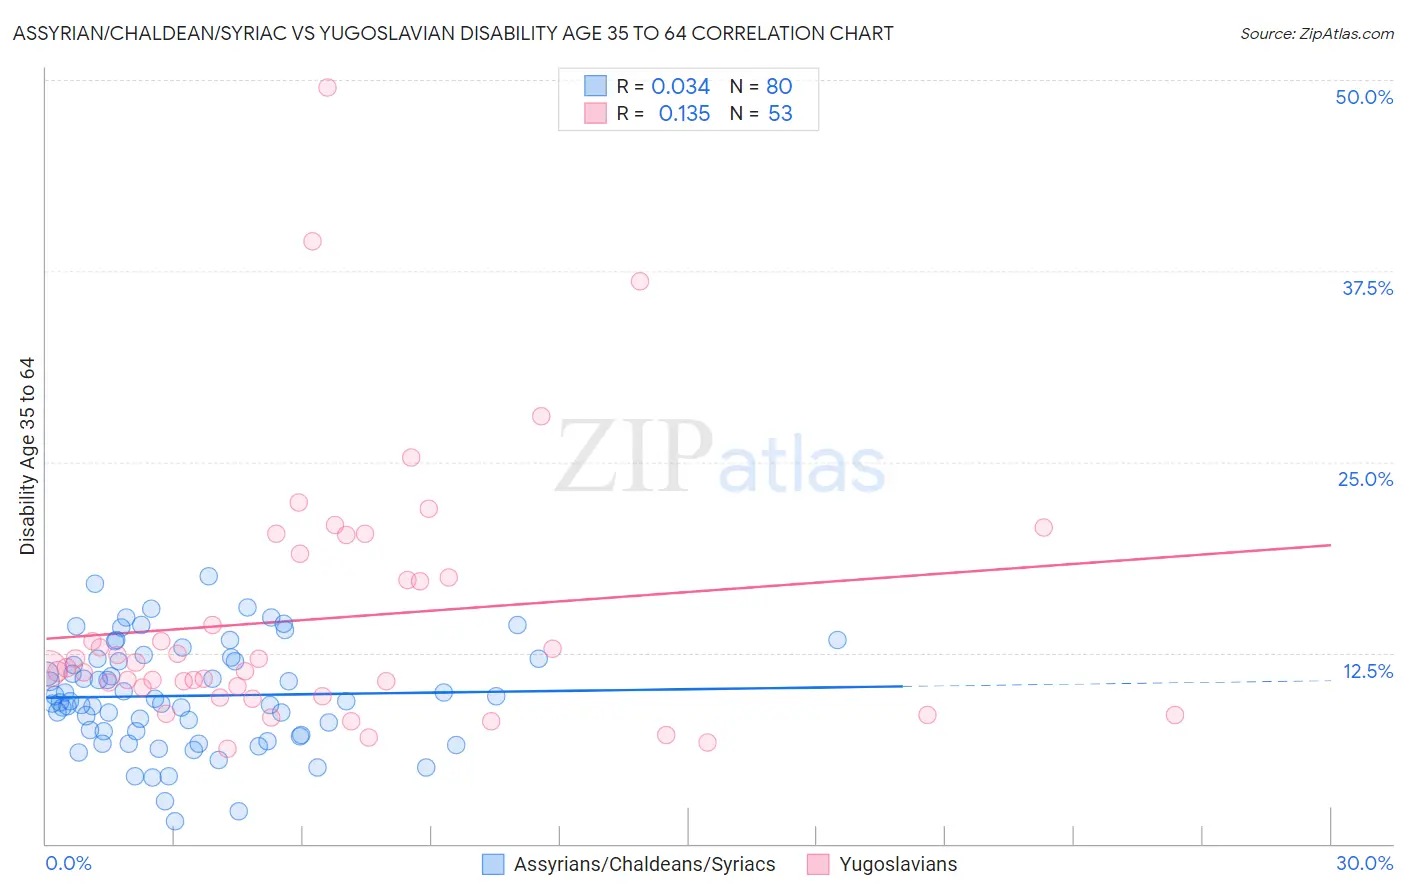
Assyrian/Chaldean/Syriac vs Yugoslavian Disability Age 35 to 64 Correlation Chart
The statistical analysis conducted on geographies consisting of 110,296,626 people shows no correlation between the proportion of Assyrians/Chaldeans/Syriacs and percentage of population with a disability between the ages 34 and 64 in the United States with a correlation coefficient (R) of 0.034 and weighted average of 10.5%. Similarly, the statistical analysis conducted on geographies consisting of 285,604,714 people shows a poor positive correlation between the proportion of Yugoslavians and percentage of population with a disability between the ages 34 and 64 in the United States with a correlation coefficient (R) of 0.135 and weighted average of 11.7%, a difference of 11.7%.
Disability Age 35 to 64 Correlation Summary
| Measurement | Assyrian/Chaldean/Syriac | Yugoslavian |
| Minimum | 1.5% | 6.2% |
| Maximum | 17.5% | 49.5% |
| Range | 16.0% | 43.3% |
| Mean | 9.7% | 14.7% |
| Median | 9.4% | 11.5% |
| Interquartile 25% (IQ1) | 7.2% | 9.9% |
| Interquartile 75% (IQ3) | 12.1% | 18.2% |
| Interquartile Range (IQR) | 4.9% | 8.3% |
| Standard Deviation (Sample) | 3.4% | 8.5% |
| Standard Deviation (Population) | 3.4% | 8.4% |
Similar Demographics by Disability Age 35 to 64
Demographics Similar to Assyrians/Chaldeans/Syriacs by Disability Age 35 to 64
In terms of disability age 35 to 64, the demographic groups most similar to Assyrians/Chaldeans/Syriacs are Brazilian (10.5%, a difference of 0.030%), Tongan (10.5%, a difference of 0.12%), Immigrants from Morocco (10.5%, a difference of 0.17%), Korean (10.5%, a difference of 0.24%), and Immigrants from Ethiopia (10.5%, a difference of 0.30%).
| Demographics | Rating | Rank | Disability Age 35 to 64 |
| Macedonians | 97.8 /100 | #105 | Exceptional 10.4% |
| Immigrants | Hungary | 97.6 /100 | #106 | Exceptional 10.4% |
| Zimbabweans | 97.4 /100 | #107 | Exceptional 10.4% |
| Ethiopians | 97.4 /100 | #108 | Exceptional 10.5% |
| Immigrants | Ethiopia | 97.2 /100 | #109 | Exceptional 10.5% |
| Koreans | 97.1 /100 | #110 | Exceptional 10.5% |
| Brazilians | 96.9 /100 | #111 | Exceptional 10.5% |
| Assyrians/Chaldeans/Syriacs | 96.8 /100 | #112 | Exceptional 10.5% |
| Tongans | 96.6 /100 | #113 | Exceptional 10.5% |
| Immigrants | Morocco | 96.6 /100 | #114 | Exceptional 10.5% |
| Immigrants | Netherlands | 96.3 /100 | #115 | Exceptional 10.5% |
| Immigrants | Nepal | 95.9 /100 | #116 | Exceptional 10.6% |
| Immigrants | South Eastern Asia | 95.7 /100 | #117 | Exceptional 10.6% |
| Immigrants | Moldova | 95.5 /100 | #118 | Exceptional 10.6% |
| Luxembourgers | 95.5 /100 | #119 | Exceptional 10.6% |
Demographics Similar to Yugoslavians by Disability Age 35 to 64
In terms of disability age 35 to 64, the demographic groups most similar to Yugoslavians are Immigrants from Jamaica (11.7%, a difference of 0.030%), Immigrants from Sudan (11.7%, a difference of 0.030%), Spanish American Indian (11.7%, a difference of 0.090%), Bahamian (11.8%, a difference of 0.18%), and Canadian (11.7%, a difference of 0.25%).
| Demographics | Rating | Rank | Disability Age 35 to 64 |
| Native Hawaiians | 14.8 /100 | #206 | Poor 11.7% |
| Ghanaians | 14.8 /100 | #207 | Poor 11.7% |
| Guatemalans | 14.6 /100 | #208 | Poor 11.7% |
| Europeans | 13.5 /100 | #209 | Poor 11.7% |
| Belgians | 13.1 /100 | #210 | Poor 11.7% |
| Canadians | 13.0 /100 | #211 | Poor 11.7% |
| Immigrants | Jamaica | 11.8 /100 | #212 | Poor 11.7% |
| Yugoslavians | 11.6 /100 | #213 | Poor 11.7% |
| Immigrants | Sudan | 11.4 /100 | #214 | Poor 11.7% |
| Spanish American Indians | 11.1 /100 | #215 | Poor 11.7% |
| Bahamians | 10.7 /100 | #216 | Poor 11.8% |
| Barbadians | 9.5 /100 | #217 | Tragic 11.8% |
| Immigrants | Bahamas | 9.2 /100 | #218 | Tragic 11.8% |
| Czechoslovakians | 9.0 /100 | #219 | Tragic 11.8% |
| Immigrants | West Indies | 8.9 /100 | #220 | Tragic 11.8% |