Sudanese vs Yugoslavian Disability Age 35 to 64
COMPARE
Sudanese
Yugoslavian
Disability Age 35 to 64
Disability Age 35 to 64 Comparison
Sudanese
Yugoslavians
11.9%
DISABILITY AGE 35 TO 64
5.3/ 100
METRIC RATING
232nd/ 347
METRIC RANK
11.7%
DISABILITY AGE 35 TO 64
11.6/ 100
METRIC RATING
213th/ 347
METRIC RANK
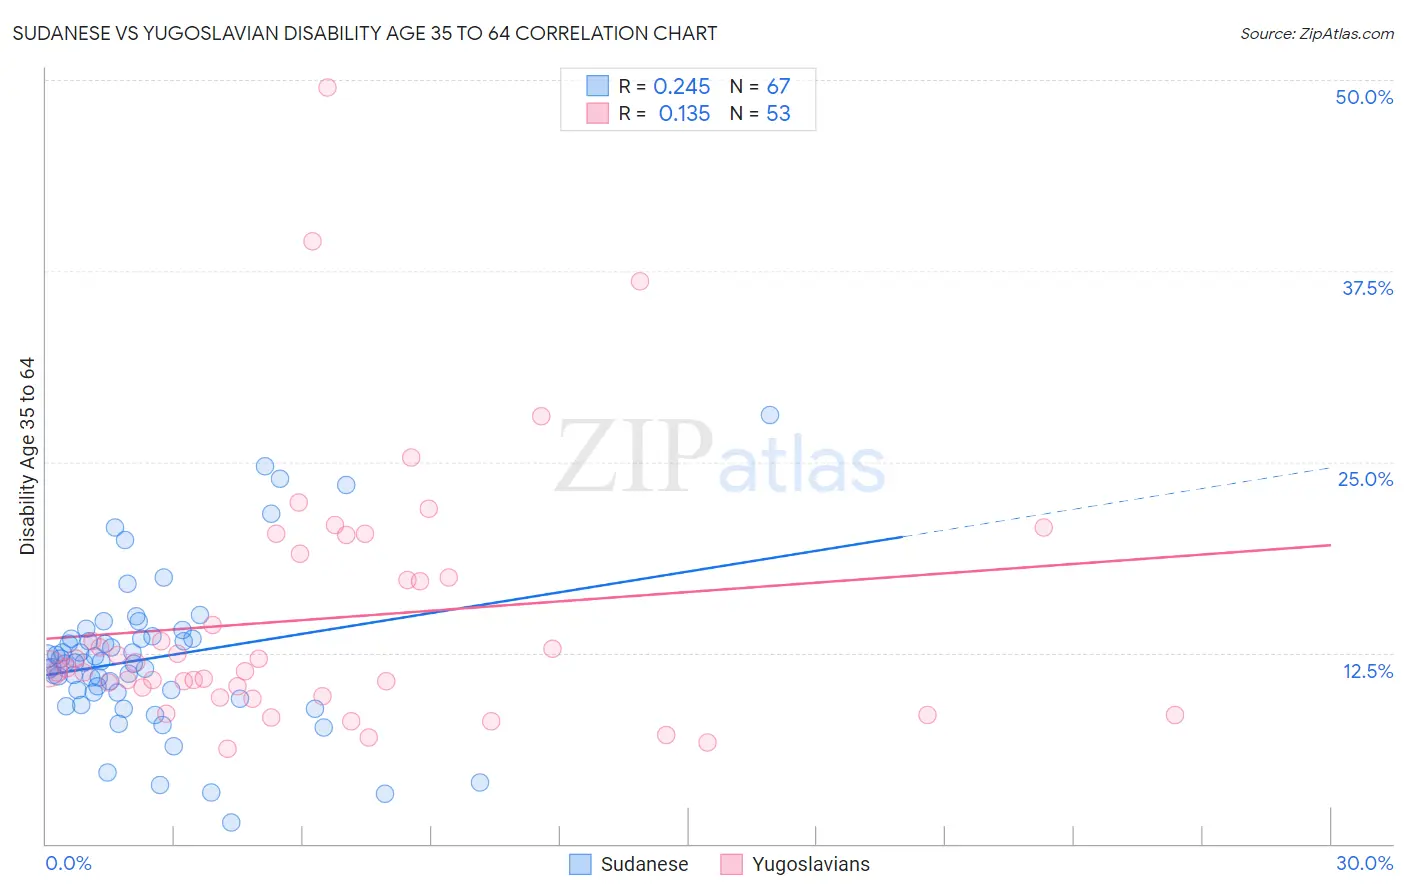
Sudanese vs Yugoslavian Disability Age 35 to 64 Correlation Chart
The statistical analysis conducted on geographies consisting of 110,102,872 people shows a weak positive correlation between the proportion of Sudanese and percentage of population with a disability between the ages 34 and 64 in the United States with a correlation coefficient (R) of 0.245 and weighted average of 11.9%. Similarly, the statistical analysis conducted on geographies consisting of 285,604,714 people shows a poor positive correlation between the proportion of Yugoslavians and percentage of population with a disability between the ages 34 and 64 in the United States with a correlation coefficient (R) of 0.135 and weighted average of 11.7%, a difference of 1.6%.
Disability Age 35 to 64 Correlation Summary
| Measurement | Sudanese | Yugoslavian |
| Minimum | 1.4% | 6.2% |
| Maximum | 28.1% | 49.5% |
| Range | 26.7% | 43.3% |
| Mean | 12.2% | 14.7% |
| Median | 11.9% | 11.5% |
| Interquartile 25% (IQ1) | 9.9% | 9.9% |
| Interquartile 75% (IQ3) | 13.4% | 18.2% |
| Interquartile Range (IQR) | 3.5% | 8.3% |
| Standard Deviation (Sample) | 5.0% | 8.5% |
| Standard Deviation (Population) | 5.0% | 8.4% |
Demographics Similar to Sudanese and Yugoslavians by Disability Age 35 to 64
In terms of disability age 35 to 64, the demographic groups most similar to Sudanese are Jamaican (11.9%, a difference of 0.14%), Panamanian (11.9%, a difference of 0.17%), British West Indian (11.9%, a difference of 0.27%), Immigrants from Germany (11.9%, a difference of 0.30%), and Immigrants from Central America (11.9%, a difference of 0.33%). Similarly, the demographic groups most similar to Yugoslavians are Immigrants from Jamaica (11.7%, a difference of 0.030%), Immigrants from Sudan (11.7%, a difference of 0.030%), Spanish American Indian (11.7%, a difference of 0.090%), Bahamian (11.8%, a difference of 0.18%), and Barbadian (11.8%, a difference of 0.44%).
| Demographics | Rating | Rank | Disability Age 35 to 64 |
| Immigrants | Jamaica | 11.8 /100 | #212 | Poor 11.7% |
| Yugoslavians | 11.6 /100 | #213 | Poor 11.7% |
| Immigrants | Sudan | 11.4 /100 | #214 | Poor 11.7% |
| Spanish American Indians | 11.1 /100 | #215 | Poor 11.7% |
| Bahamians | 10.7 /100 | #216 | Poor 11.8% |
| Barbadians | 9.5 /100 | #217 | Tragic 11.8% |
| Immigrants | Bahamas | 9.2 /100 | #218 | Tragic 11.8% |
| Czechoslovakians | 9.0 /100 | #219 | Tragic 11.8% |
| Immigrants | West Indies | 8.9 /100 | #220 | Tragic 11.8% |
| Alsatians | 8.5 /100 | #221 | Tragic 11.8% |
| Hondurans | 8.4 /100 | #222 | Tragic 11.8% |
| Immigrants | Honduras | 8.4 /100 | #223 | Tragic 11.8% |
| Immigrants | Ghana | 7.8 /100 | #224 | Tragic 11.8% |
| Immigrants | Belize | 6.6 /100 | #225 | Tragic 11.9% |
| Scandinavians | 6.4 /100 | #226 | Tragic 11.9% |
| Immigrants | Central America | 6.3 /100 | #227 | Tragic 11.9% |
| Immigrants | Germany | 6.2 /100 | #228 | Tragic 11.9% |
| British West Indians | 6.1 /100 | #229 | Tragic 11.9% |
| Panamanians | 5.8 /100 | #230 | Tragic 11.9% |
| Jamaicans | 5.7 /100 | #231 | Tragic 11.9% |
| Sudanese | 5.3 /100 | #232 | Tragic 11.9% |