Immigrants from Bosnia and Herzegovina vs Yugoslavian Disability Age 35 to 64
COMPARE
Immigrants from Bosnia and Herzegovina
Yugoslavian
Disability Age 35 to 64
Disability Age 35 to 64 Comparison
Immigrants from Bosnia and Herzegovina
Yugoslavians
11.4%
DISABILITY AGE 35 TO 64
35.2/ 100
METRIC RATING
187th/ 347
METRIC RANK
11.7%
DISABILITY AGE 35 TO 64
11.6/ 100
METRIC RATING
213th/ 347
METRIC RANK
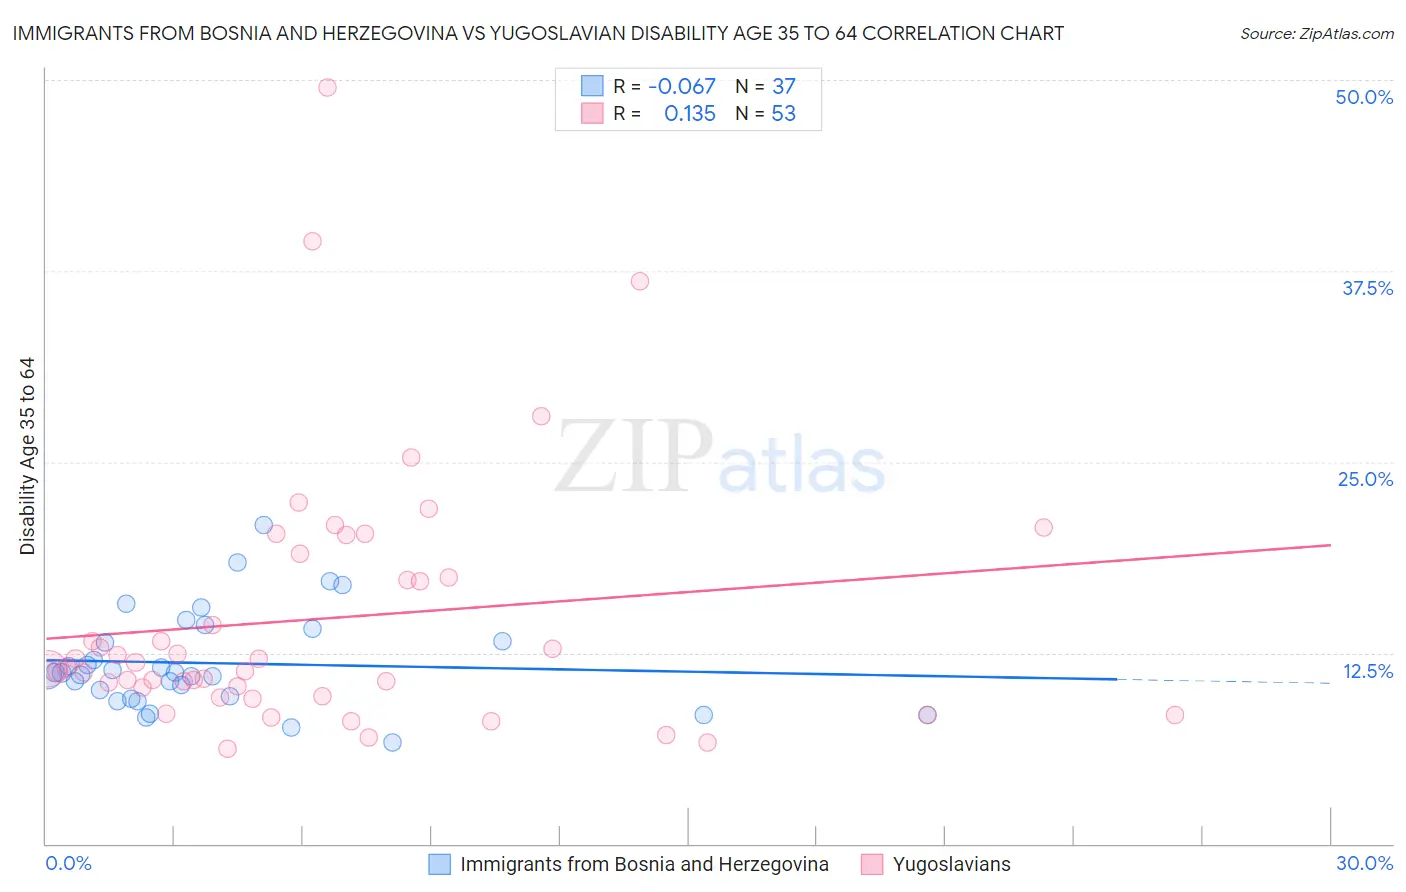
Immigrants from Bosnia and Herzegovina vs Yugoslavian Disability Age 35 to 64 Correlation Chart
The statistical analysis conducted on geographies consisting of 156,799,711 people shows a slight negative correlation between the proportion of Immigrants from Bosnia and Herzegovina and percentage of population with a disability between the ages 34 and 64 in the United States with a correlation coefficient (R) of -0.067 and weighted average of 11.4%. Similarly, the statistical analysis conducted on geographies consisting of 285,604,714 people shows a poor positive correlation between the proportion of Yugoslavians and percentage of population with a disability between the ages 34 and 64 in the United States with a correlation coefficient (R) of 0.135 and weighted average of 11.7%, a difference of 2.8%.
Disability Age 35 to 64 Correlation Summary
| Measurement | Immigrants from Bosnia and Herzegovina | Yugoslavian |
| Minimum | 6.7% | 6.2% |
| Maximum | 20.9% | 49.5% |
| Range | 14.2% | 43.3% |
| Mean | 11.8% | 14.7% |
| Median | 11.2% | 11.5% |
| Interquartile 25% (IQ1) | 9.6% | 9.9% |
| Interquartile 75% (IQ3) | 13.7% | 18.2% |
| Interquartile Range (IQR) | 4.1% | 8.3% |
| Standard Deviation (Sample) | 3.1% | 8.5% |
| Standard Deviation (Population) | 3.1% | 8.4% |
Similar Demographics by Disability Age 35 to 64
Demographics Similar to Immigrants from Bosnia and Herzegovina by Disability Age 35 to 64
In terms of disability age 35 to 64, the demographic groups most similar to Immigrants from Bosnia and Herzegovina are Northern European (11.4%, a difference of 0.020%), Hungarian (11.4%, a difference of 0.050%), Slovene (11.4%, a difference of 0.13%), Danish (11.4%, a difference of 0.14%), and Immigrants from Nigeria (11.4%, a difference of 0.24%).
| Demographics | Rating | Rank | Disability Age 35 to 64 |
| Immigrants | Caribbean | 41.5 /100 | #180 | Average 11.3% |
| Trinidadians and Tobagonians | 40.8 /100 | #181 | Average 11.4% |
| Icelanders | 39.7 /100 | #182 | Fair 11.4% |
| Immigrants | Oceania | 39.5 /100 | #183 | Fair 11.4% |
| Kenyans | 39.2 /100 | #184 | Fair 11.4% |
| Danes | 36.8 /100 | #185 | Fair 11.4% |
| Slovenes | 36.6 /100 | #186 | Fair 11.4% |
| Immigrants | Bosnia and Herzegovina | 35.2 /100 | #187 | Fair 11.4% |
| Northern Europeans | 34.9 /100 | #188 | Fair 11.4% |
| Hungarians | 34.6 /100 | #189 | Fair 11.4% |
| Immigrants | Nigeria | 32.5 /100 | #190 | Fair 11.4% |
| Swedes | 31.3 /100 | #191 | Fair 11.4% |
| Norwegians | 29.7 /100 | #192 | Fair 11.5% |
| Immigrants | Africa | 29.0 /100 | #193 | Fair 11.5% |
| Immigrants | Latin America | 27.5 /100 | #194 | Fair 11.5% |
Demographics Similar to Yugoslavians by Disability Age 35 to 64
In terms of disability age 35 to 64, the demographic groups most similar to Yugoslavians are Immigrants from Jamaica (11.7%, a difference of 0.030%), Immigrants from Sudan (11.7%, a difference of 0.030%), Spanish American Indian (11.7%, a difference of 0.090%), Bahamian (11.8%, a difference of 0.18%), and Canadian (11.7%, a difference of 0.25%).
| Demographics | Rating | Rank | Disability Age 35 to 64 |
| Native Hawaiians | 14.8 /100 | #206 | Poor 11.7% |
| Ghanaians | 14.8 /100 | #207 | Poor 11.7% |
| Guatemalans | 14.6 /100 | #208 | Poor 11.7% |
| Europeans | 13.5 /100 | #209 | Poor 11.7% |
| Belgians | 13.1 /100 | #210 | Poor 11.7% |
| Canadians | 13.0 /100 | #211 | Poor 11.7% |
| Immigrants | Jamaica | 11.8 /100 | #212 | Poor 11.7% |
| Yugoslavians | 11.6 /100 | #213 | Poor 11.7% |
| Immigrants | Sudan | 11.4 /100 | #214 | Poor 11.7% |
| Spanish American Indians | 11.1 /100 | #215 | Poor 11.7% |
| Bahamians | 10.7 /100 | #216 | Poor 11.8% |
| Barbadians | 9.5 /100 | #217 | Tragic 11.8% |
| Immigrants | Bahamas | 9.2 /100 | #218 | Tragic 11.8% |
| Czechoslovakians | 9.0 /100 | #219 | Tragic 11.8% |
| Immigrants | West Indies | 8.9 /100 | #220 | Tragic 11.8% |