White/Caucasian vs Sudanese Disability Age 35 to 64
COMPARE
White/Caucasian
Sudanese
Disability Age 35 to 64
Disability Age 35 to 64 Comparison
Whites/Caucasians
Sudanese
12.6%
DISABILITY AGE 35 TO 64
0.3/ 100
METRIC RATING
266th/ 347
METRIC RANK
11.9%
DISABILITY AGE 35 TO 64
5.3/ 100
METRIC RATING
232nd/ 347
METRIC RANK
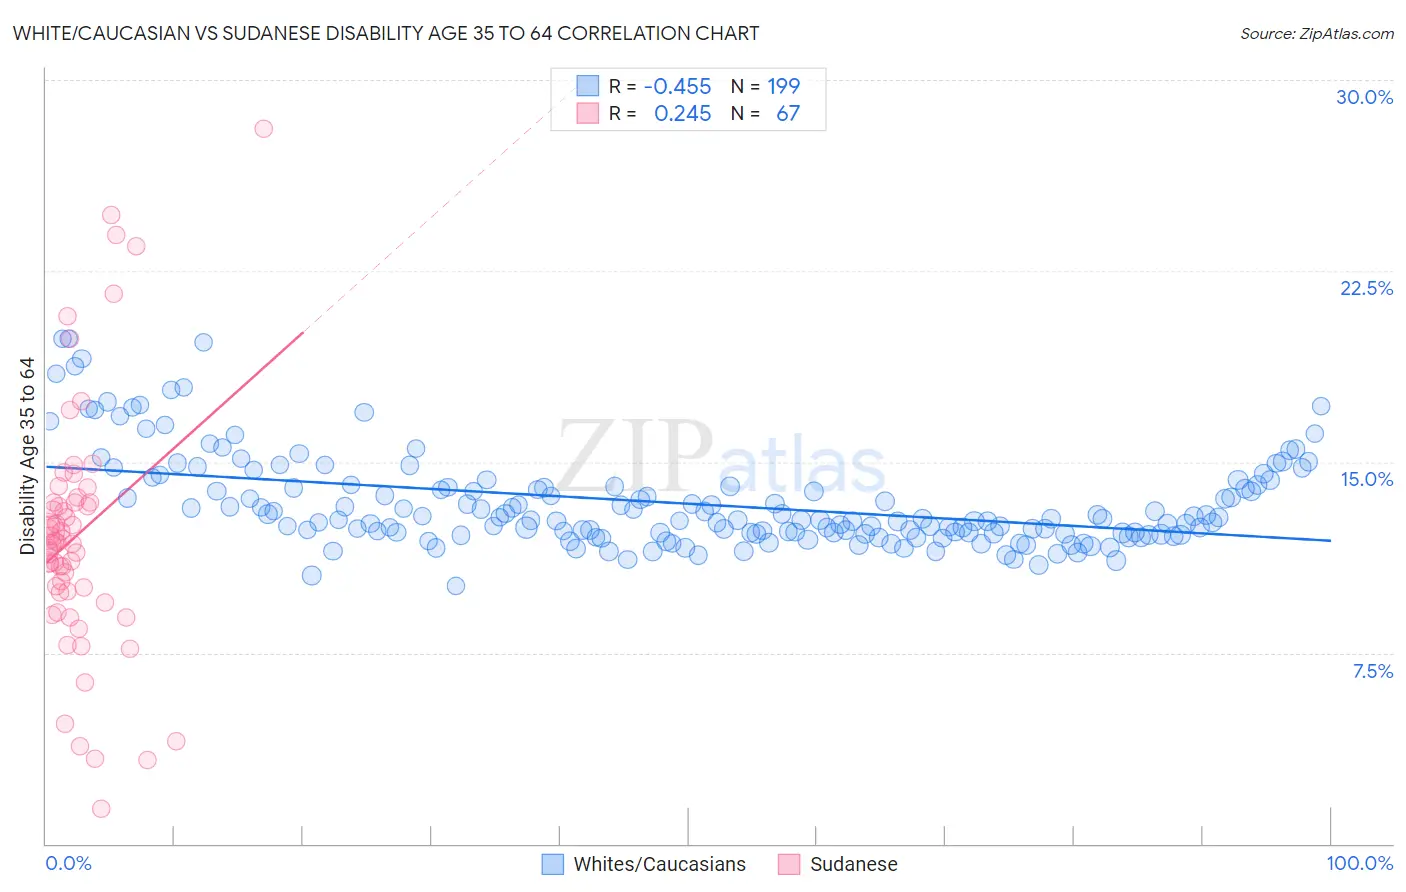
White/Caucasian vs Sudanese Disability Age 35 to 64 Correlation Chart
The statistical analysis conducted on geographies consisting of 582,010,909 people shows a moderate negative correlation between the proportion of Whites/Caucasians and percentage of population with a disability between the ages 34 and 64 in the United States with a correlation coefficient (R) of -0.455 and weighted average of 12.6%. Similarly, the statistical analysis conducted on geographies consisting of 110,102,872 people shows a weak positive correlation between the proportion of Sudanese and percentage of population with a disability between the ages 34 and 64 in the United States with a correlation coefficient (R) of 0.245 and weighted average of 11.9%, a difference of 5.9%.
Disability Age 35 to 64 Correlation Summary
| Measurement | White/Caucasian | Sudanese |
| Minimum | 10.1% | 1.4% |
| Maximum | 19.8% | 28.1% |
| Range | 9.7% | 26.7% |
| Mean | 13.4% | 12.2% |
| Median | 12.7% | 11.9% |
| Interquartile 25% (IQ1) | 12.2% | 9.9% |
| Interquartile 75% (IQ3) | 14.0% | 13.4% |
| Interquartile Range (IQR) | 1.8% | 3.5% |
| Standard Deviation (Sample) | 1.8% | 5.0% |
| Standard Deviation (Population) | 1.8% | 5.0% |
Similar Demographics by Disability Age 35 to 64
Demographics Similar to Whites/Caucasians by Disability Age 35 to 64
In terms of disability age 35 to 64, the demographic groups most similar to Whites/Caucasians are Subsaharan African (12.6%, a difference of 0.16%), Immigrants from Dominica (12.7%, a difference of 0.34%), Spanish (12.7%, a difference of 0.44%), French (12.7%, a difference of 0.48%), and Marshallese (12.5%, a difference of 0.71%).
| Demographics | Rating | Rank | Disability Age 35 to 64 |
| English | 0.6 /100 | #259 | Tragic 12.4% |
| German Russians | 0.5 /100 | #260 | Tragic 12.5% |
| Malaysians | 0.5 /100 | #261 | Tragic 12.5% |
| Senegalese | 0.5 /100 | #262 | Tragic 12.5% |
| Immigrants | Zaire | 0.4 /100 | #263 | Tragic 12.5% |
| Immigrants | Portugal | 0.4 /100 | #264 | Tragic 12.5% |
| Marshallese | 0.4 /100 | #265 | Tragic 12.5% |
| Whites/Caucasians | 0.3 /100 | #266 | Tragic 12.6% |
| Sub-Saharan Africans | 0.2 /100 | #267 | Tragic 12.6% |
| Immigrants | Dominica | 0.2 /100 | #268 | Tragic 12.7% |
| Spanish | 0.2 /100 | #269 | Tragic 12.7% |
| French | 0.2 /100 | #270 | Tragic 12.7% |
| Nepalese | 0.1 /100 | #271 | Tragic 12.8% |
| U.S. Virgin Islanders | 0.1 /100 | #272 | Tragic 12.8% |
| Pennsylvania Germans | 0.1 /100 | #273 | Tragic 12.8% |
Demographics Similar to Sudanese by Disability Age 35 to 64
In terms of disability age 35 to 64, the demographic groups most similar to Sudanese are Bermudan (11.9%, a difference of 0.11%), Jamaican (11.9%, a difference of 0.14%), Panamanian (11.9%, a difference of 0.17%), Portuguese (11.9%, a difference of 0.18%), and British West Indian (11.9%, a difference of 0.27%).
| Demographics | Rating | Rank | Disability Age 35 to 64 |
| Immigrants | Belize | 6.6 /100 | #225 | Tragic 11.9% |
| Scandinavians | 6.4 /100 | #226 | Tragic 11.9% |
| Immigrants | Central America | 6.3 /100 | #227 | Tragic 11.9% |
| Immigrants | Germany | 6.2 /100 | #228 | Tragic 11.9% |
| British West Indians | 6.1 /100 | #229 | Tragic 11.9% |
| Panamanians | 5.8 /100 | #230 | Tragic 11.9% |
| Jamaicans | 5.7 /100 | #231 | Tragic 11.9% |
| Sudanese | 5.3 /100 | #232 | Tragic 11.9% |
| Bermudans | 5.0 /100 | #233 | Tragic 11.9% |
| Portuguese | 4.9 /100 | #234 | Tragic 11.9% |
| Belizeans | 4.5 /100 | #235 | Tragic 12.0% |
| Immigrants | Middle Africa | 4.5 /100 | #236 | Tragic 12.0% |
| Immigrants | Cambodia | 3.9 /100 | #237 | Tragic 12.0% |
| West Indians | 3.7 /100 | #238 | Tragic 12.0% |
| Immigrants | Western Africa | 3.3 /100 | #239 | Tragic 12.0% |