Immigrants from Italy vs Senegalese Disability Age 18 to 34
COMPARE
Immigrants from Italy
Senegalese
Disability Age 18 to 34
Disability Age 18 to 34 Comparison
Immigrants from Italy
Senegalese
6.3%
DISABILITY AGE 18 TO 34
90.5/ 100
METRIC RATING
129th/ 347
METRIC RANK
6.9%
DISABILITY AGE 18 TO 34
4.9/ 100
METRIC RATING
224th/ 347
METRIC RANK
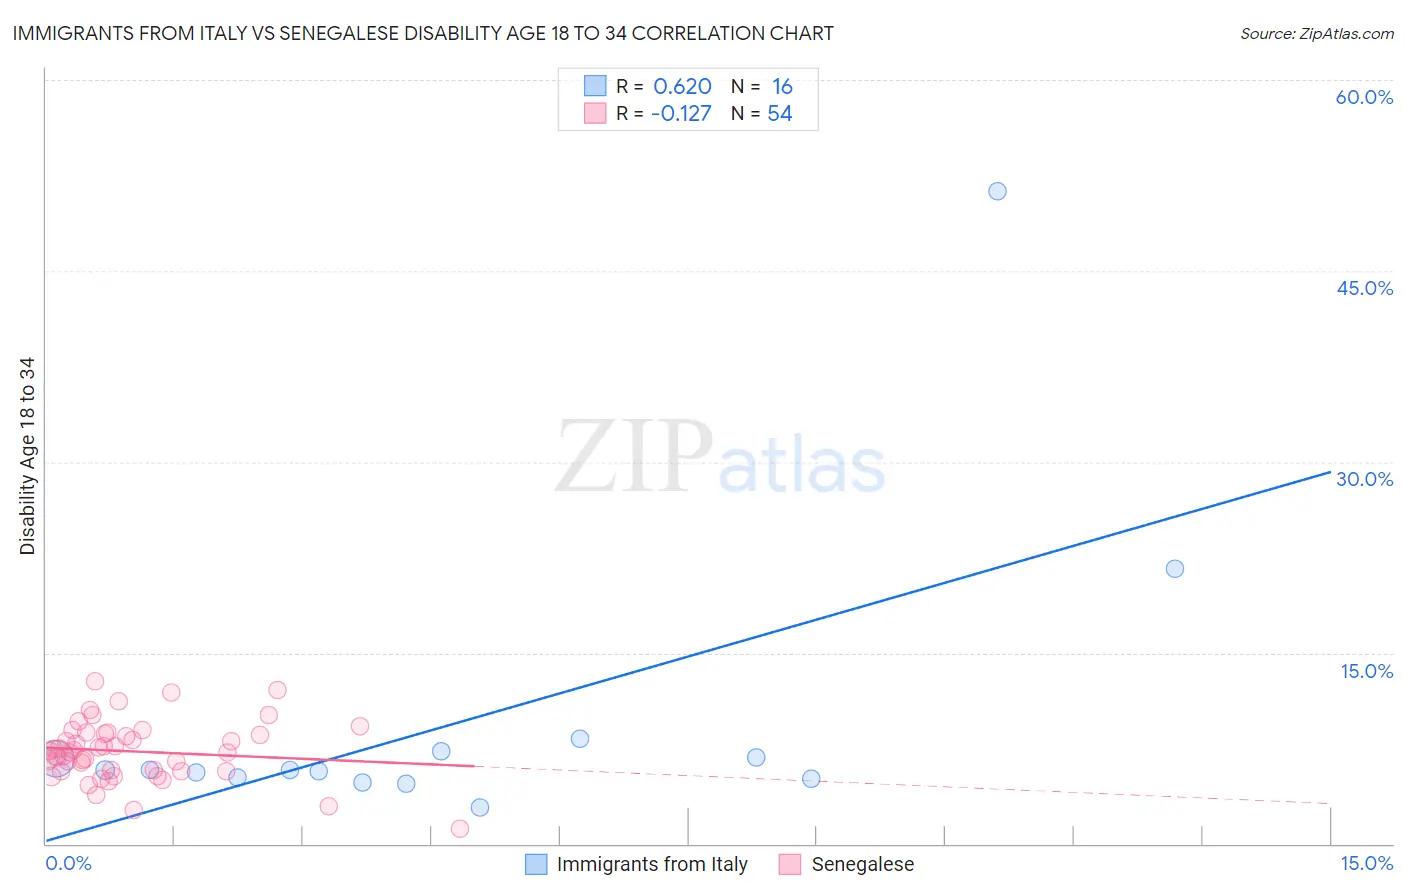
Immigrants from Italy vs Senegalese Disability Age 18 to 34 Correlation Chart
The statistical analysis conducted on geographies consisting of 323,455,577 people shows a significant positive correlation between the proportion of Immigrants from Italy and percentage of population with a disability between the ages 18 and 35 in the United States with a correlation coefficient (R) of 0.620 and weighted average of 6.3%. Similarly, the statistical analysis conducted on geographies consisting of 78,132,193 people shows a poor negative correlation between the proportion of Senegalese and percentage of population with a disability between the ages 18 and 35 in the United States with a correlation coefficient (R) of -0.127 and weighted average of 6.9%, a difference of 9.4%.
Disability Age 18 to 34 Correlation Summary
| Measurement | Immigrants from Italy | Senegalese |
| Minimum | 2.8% | 1.2% |
| Maximum | 51.2% | 12.8% |
| Range | 48.4% | 11.6% |
| Mean | 9.6% | 7.3% |
| Median | 5.8% | 7.2% |
| Interquartile 25% (IQ1) | 5.2% | 5.7% |
| Interquartile 75% (IQ3) | 7.0% | 8.7% |
| Interquartile Range (IQR) | 1.9% | 2.9% |
| Standard Deviation (Sample) | 11.8% | 2.3% |
| Standard Deviation (Population) | 11.5% | 2.3% |
Similar Demographics by Disability Age 18 to 34
Demographics Similar to Immigrants from Italy by Disability Age 18 to 34
In terms of disability age 18 to 34, the demographic groups most similar to Immigrants from Italy are Immigrants from Dominica (6.3%, a difference of 0.010%), Immigrants from Saudi Arabia (6.3%, a difference of 0.020%), Guatemalan (6.4%, a difference of 0.19%), Chinese (6.3%, a difference of 0.31%), and Brazilian (6.4%, a difference of 0.31%).
| Demographics | Rating | Rank | Disability Age 18 to 34 |
| Immigrants | Czechoslovakia | 93.3 /100 | #122 | Exceptional 6.3% |
| Costa Ricans | 92.9 /100 | #123 | Exceptional 6.3% |
| Immigrants | Morocco | 92.9 /100 | #124 | Exceptional 6.3% |
| Macedonians | 92.6 /100 | #125 | Exceptional 6.3% |
| Immigrants | Switzerland | 92.5 /100 | #126 | Exceptional 6.3% |
| West Indians | 92.0 /100 | #127 | Exceptional 6.3% |
| Chinese | 91.9 /100 | #128 | Exceptional 6.3% |
| Immigrants | Italy | 90.5 /100 | #129 | Exceptional 6.3% |
| Immigrants | Dominica | 90.5 /100 | #130 | Exceptional 6.3% |
| Immigrants | Saudi Arabia | 90.4 /100 | #131 | Exceptional 6.3% |
| Guatemalans | 89.6 /100 | #132 | Excellent 6.4% |
| Brazilians | 89.0 /100 | #133 | Excellent 6.4% |
| Immigrants | Europe | 88.8 /100 | #134 | Excellent 6.4% |
| Palestinians | 88.5 /100 | #135 | Excellent 6.4% |
| Immigrants | Sweden | 88.5 /100 | #136 | Excellent 6.4% |
Demographics Similar to Senegalese by Disability Age 18 to 34
In terms of disability age 18 to 34, the demographic groups most similar to Senegalese are Carpatho Rusyn (6.9%, a difference of 0.090%), Central American Indian (6.9%, a difference of 0.090%), Immigrants from England (6.9%, a difference of 0.12%), Immigrants from Middle Africa (6.9%, a difference of 0.19%), and Ugandan (6.9%, a difference of 0.19%).
| Demographics | Rating | Rank | Disability Age 18 to 34 |
| Immigrants | Kenya | 6.9 /100 | #217 | Tragic 6.9% |
| Ukrainians | 6.7 /100 | #218 | Tragic 6.9% |
| Hawaiians | 6.5 /100 | #219 | Tragic 6.9% |
| Immigrants | Senegal | 5.5 /100 | #220 | Tragic 6.9% |
| Immigrants | Middle Africa | 5.5 /100 | #221 | Tragic 6.9% |
| Immigrants | England | 5.3 /100 | #222 | Tragic 6.9% |
| Carpatho Rusyns | 5.2 /100 | #223 | Tragic 6.9% |
| Senegalese | 4.9 /100 | #224 | Tragic 6.9% |
| Central American Indians | 4.7 /100 | #225 | Tragic 6.9% |
| Ugandans | 4.4 /100 | #226 | Tragic 6.9% |
| Immigrants | Canada | 4.3 /100 | #227 | Tragic 7.0% |
| Immigrants | Yemen | 4.2 /100 | #228 | Tragic 7.0% |
| Lithuanians | 4.1 /100 | #229 | Tragic 7.0% |
| Immigrants | North America | 3.9 /100 | #230 | Tragic 7.0% |
| Ute | 3.8 /100 | #231 | Tragic 7.0% |