Albanian vs Portuguese Disability Age 18 to 34
COMPARE
Albanian
Portuguese
Disability Age 18 to 34
Disability Age 18 to 34 Comparison
Albanians
Portuguese
6.4%
DISABILITY AGE 18 TO 34
85.3/ 100
METRIC RATING
144th/ 347
METRIC RANK
7.4%
DISABILITY AGE 18 TO 34
0.1/ 100
METRIC RATING
268th/ 347
METRIC RANK
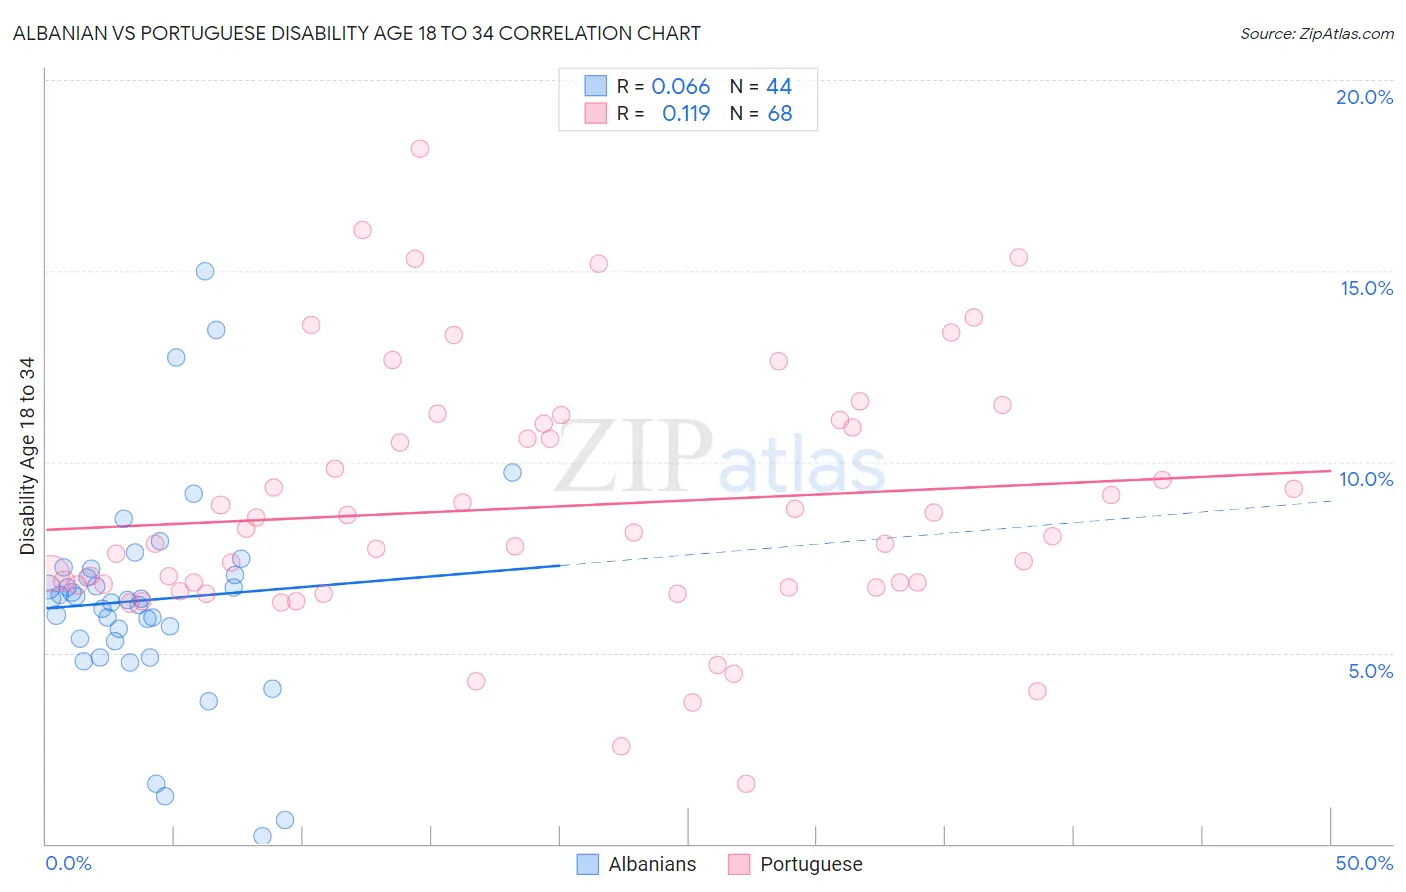
Albanian vs Portuguese Disability Age 18 to 34 Correlation Chart
The statistical analysis conducted on geographies consisting of 192,986,276 people shows a slight positive correlation between the proportion of Albanians and percentage of population with a disability between the ages 18 and 35 in the United States with a correlation coefficient (R) of 0.066 and weighted average of 6.4%. Similarly, the statistical analysis conducted on geographies consisting of 448,622,117 people shows a poor positive correlation between the proportion of Portuguese and percentage of population with a disability between the ages 18 and 35 in the United States with a correlation coefficient (R) of 0.119 and weighted average of 7.4%, a difference of 15.2%.
Disability Age 18 to 34 Correlation Summary
| Measurement | Albanian | Portuguese |
| Minimum | 0.20% | 1.6% |
| Maximum | 15.0% | 18.2% |
| Range | 14.8% | 16.6% |
| Mean | 6.4% | 8.8% |
| Median | 6.4% | 8.1% |
| Interquartile 25% (IQ1) | 5.3% | 6.7% |
| Interquartile 75% (IQ3) | 7.1% | 10.9% |
| Interquartile Range (IQR) | 1.8% | 4.2% |
| Standard Deviation (Sample) | 2.8% | 3.3% |
| Standard Deviation (Population) | 2.8% | 3.3% |
Similar Demographics by Disability Age 18 to 34
Demographics Similar to Albanians by Disability Age 18 to 34
In terms of disability age 18 to 34, the demographic groups most similar to Albanians are Moroccan (6.4%, a difference of 0.0%), Belizean (6.4%, a difference of 0.060%), Immigrants from Latvia (6.4%, a difference of 0.17%), South American Indian (6.4%, a difference of 0.19%), and Jamaican (6.4%, a difference of 0.22%).
| Demographics | Rating | Rank | Disability Age 18 to 34 |
| Immigrants | Honduras | 87.7 /100 | #137 | Excellent 6.4% |
| Spanish American Indians | 87.7 /100 | #138 | Excellent 6.4% |
| Immigrants | Belize | 87.4 /100 | #139 | Excellent 6.4% |
| Immigrants | Fiji | 87.3 /100 | #140 | Excellent 6.4% |
| Jamaicans | 86.8 /100 | #141 | Excellent 6.4% |
| South American Indians | 86.5 /100 | #142 | Excellent 6.4% |
| Immigrants | Latvia | 86.4 /100 | #143 | Excellent 6.4% |
| Albanians | 85.3 /100 | #144 | Excellent 6.4% |
| Moroccans | 85.2 /100 | #145 | Excellent 6.4% |
| Belizeans | 84.9 /100 | #146 | Excellent 6.4% |
| Immigrants | South Africa | 83.7 /100 | #147 | Excellent 6.4% |
| Immigrants | Belgium | 83.5 /100 | #148 | Excellent 6.4% |
| Hondurans | 83.1 /100 | #149 | Excellent 6.4% |
| Immigrants | Dominican Republic | 82.7 /100 | #150 | Excellent 6.4% |
| Tongans | 81.9 /100 | #151 | Excellent 6.4% |
Demographics Similar to Portuguese by Disability Age 18 to 34
In terms of disability age 18 to 34, the demographic groups most similar to Portuguese are Basque (7.4%, a difference of 0.040%), Bangladeshi (7.4%, a difference of 0.080%), Belgian (7.4%, a difference of 0.13%), German Russian (7.4%, a difference of 0.14%), and Swiss (7.4%, a difference of 0.18%).
| Demographics | Rating | Rank | Disability Age 18 to 34 |
| Northern Europeans | 0.2 /100 | #261 | Tragic 7.3% |
| Canadians | 0.2 /100 | #262 | Tragic 7.3% |
| British | 0.2 /100 | #263 | Tragic 7.3% |
| Bermudans | 0.1 /100 | #264 | Tragic 7.3% |
| Slovenes | 0.1 /100 | #265 | Tragic 7.3% |
| German Russians | 0.1 /100 | #266 | Tragic 7.4% |
| Bangladeshis | 0.1 /100 | #267 | Tragic 7.4% |
| Portuguese | 0.1 /100 | #268 | Tragic 7.4% |
| Basques | 0.1 /100 | #269 | Tragic 7.4% |
| Belgians | 0.1 /100 | #270 | Tragic 7.4% |
| Swiss | 0.1 /100 | #271 | Tragic 7.4% |
| Tsimshian | 0.1 /100 | #272 | Tragic 7.4% |
| Slavs | 0.1 /100 | #273 | Tragic 7.4% |
| Africans | 0.1 /100 | #274 | Tragic 7.4% |
| Immigrants | Somalia | 0.1 /100 | #275 | Tragic 7.4% |