Immigrants from Moldova vs Nepalese Disability
COMPARE
Immigrants from Moldova
Nepalese
Disability
Disability Comparison
Immigrants from Moldova
Nepalese
11.6%
DISABILITY
72.0/ 100
METRIC RATING
152nd/ 347
METRIC RANK
12.8%
DISABILITY
0.0/ 100
METRIC RATING
274th/ 347
METRIC RANK
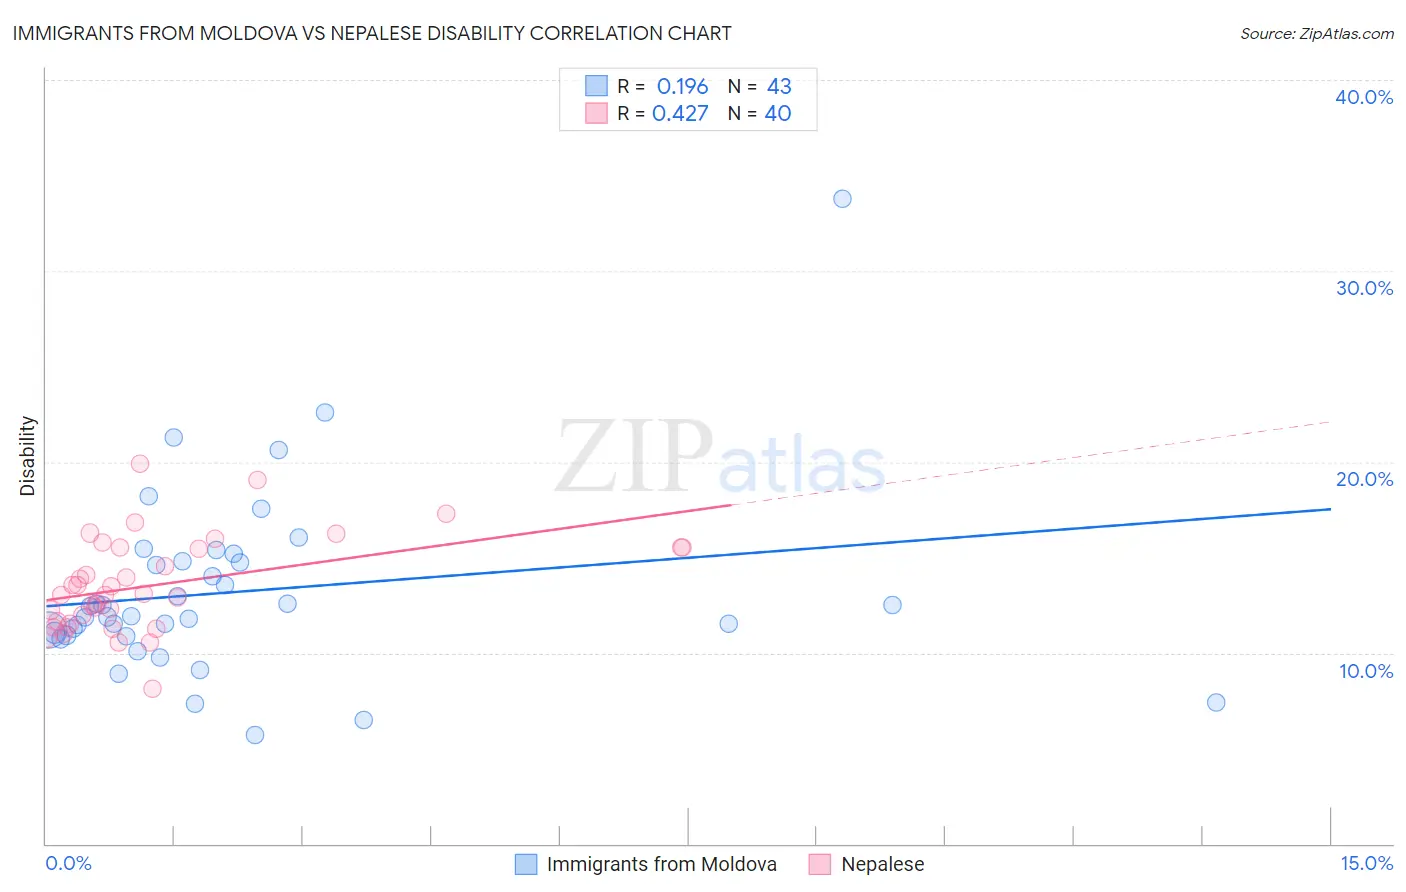
Immigrants from Moldova vs Nepalese Disability Correlation Chart
The statistical analysis conducted on geographies consisting of 124,386,005 people shows a poor positive correlation between the proportion of Immigrants from Moldova and percentage of population with a disability in the United States with a correlation coefficient (R) of 0.196 and weighted average of 11.6%. Similarly, the statistical analysis conducted on geographies consisting of 24,521,755 people shows a moderate positive correlation between the proportion of Nepalese and percentage of population with a disability in the United States with a correlation coefficient (R) of 0.427 and weighted average of 12.8%, a difference of 10.3%.
Disability Correlation Summary
| Measurement | Immigrants from Moldova | Nepalese |
| Minimum | 5.7% | 8.1% |
| Maximum | 33.8% | 19.9% |
| Range | 28.1% | 11.8% |
| Mean | 13.2% | 13.5% |
| Median | 11.9% | 13.1% |
| Interquartile 25% (IQ1) | 10.9% | 11.6% |
| Interquartile 75% (IQ3) | 14.8% | 15.5% |
| Interquartile Range (IQR) | 3.9% | 3.9% |
| Standard Deviation (Sample) | 4.8% | 2.5% |
| Standard Deviation (Population) | 4.8% | 2.4% |
Similar Demographics by Disability
Demographics Similar to Immigrants from Moldova by Disability
In terms of disability, the demographic groups most similar to Immigrants from Moldova are Immigrants from Kenya (11.6%, a difference of 0.0%), Romanian (11.6%, a difference of 0.040%), Immigrants from Ghana (11.6%, a difference of 0.050%), Immigrants from Guatemala (11.6%, a difference of 0.050%), and Immigrants from Norway (11.6%, a difference of 0.060%).
| Demographics | Rating | Rank | Disability |
| Nigerians | 81.3 /100 | #145 | Excellent 11.5% |
| Immigrants | Hungary | 79.0 /100 | #146 | Good 11.5% |
| Immigrants | Ukraine | 77.6 /100 | #147 | Good 11.5% |
| Sudanese | 77.1 /100 | #148 | Good 11.5% |
| Immigrants | Norway | 73.2 /100 | #149 | Good 11.6% |
| Romanians | 72.7 /100 | #150 | Good 11.6% |
| Immigrants | Kenya | 72.1 /100 | #151 | Good 11.6% |
| Immigrants | Moldova | 72.0 /100 | #152 | Good 11.6% |
| Immigrants | Ghana | 71.2 /100 | #153 | Good 11.6% |
| Immigrants | Guatemala | 71.1 /100 | #154 | Good 11.6% |
| Immigrants | Netherlands | 69.8 /100 | #155 | Good 11.6% |
| Immigrants | Fiji | 69.5 /100 | #156 | Good 11.6% |
| Immigrants | Middle Africa | 69.5 /100 | #157 | Good 11.6% |
| Armenians | 65.9 /100 | #158 | Good 11.6% |
| Guatemalans | 65.1 /100 | #159 | Good 11.6% |
Demographics Similar to Nepalese by Disability
In terms of disability, the demographic groups most similar to Nepalese are Sioux (12.8%, a difference of 0.080%), Hmong (12.8%, a difference of 0.23%), Dutch (12.8%, a difference of 0.28%), Finnish (12.7%, a difference of 0.43%), and German (12.8%, a difference of 0.45%).
| Demographics | Rating | Rank | Disability |
| Spaniards | 0.2 /100 | #267 | Tragic 12.5% |
| Bangladeshis | 0.1 /100 | #268 | Tragic 12.6% |
| Immigrants | Dominican Republic | 0.1 /100 | #269 | Tragic 12.6% |
| Portuguese | 0.1 /100 | #270 | Tragic 12.6% |
| Immigrants | Yemen | 0.1 /100 | #271 | Tragic 12.6% |
| Dominicans | 0.0 /100 | #272 | Tragic 12.7% |
| Finns | 0.0 /100 | #273 | Tragic 12.7% |
| Nepalese | 0.0 /100 | #274 | Tragic 12.8% |
| Sioux | 0.0 /100 | #275 | Tragic 12.8% |
| Hmong | 0.0 /100 | #276 | Tragic 12.8% |
| Dutch | 0.0 /100 | #277 | Tragic 12.8% |
| Germans | 0.0 /100 | #278 | Tragic 12.8% |
| Fijians | 0.0 /100 | #279 | Tragic 12.8% |
| Spanish | 0.0 /100 | #280 | Tragic 12.8% |
| Immigrants | Portugal | 0.0 /100 | #281 | Tragic 12.9% |