Immigrants from Saudi Arabia vs Nepalese Disability
COMPARE
Immigrants from Saudi Arabia
Nepalese
Disability
Disability Comparison
Immigrants from Saudi Arabia
Nepalese
10.9%
DISABILITY
99.9/ 100
METRIC RATING
50th/ 347
METRIC RANK
12.8%
DISABILITY
0.0/ 100
METRIC RATING
274th/ 347
METRIC RANK
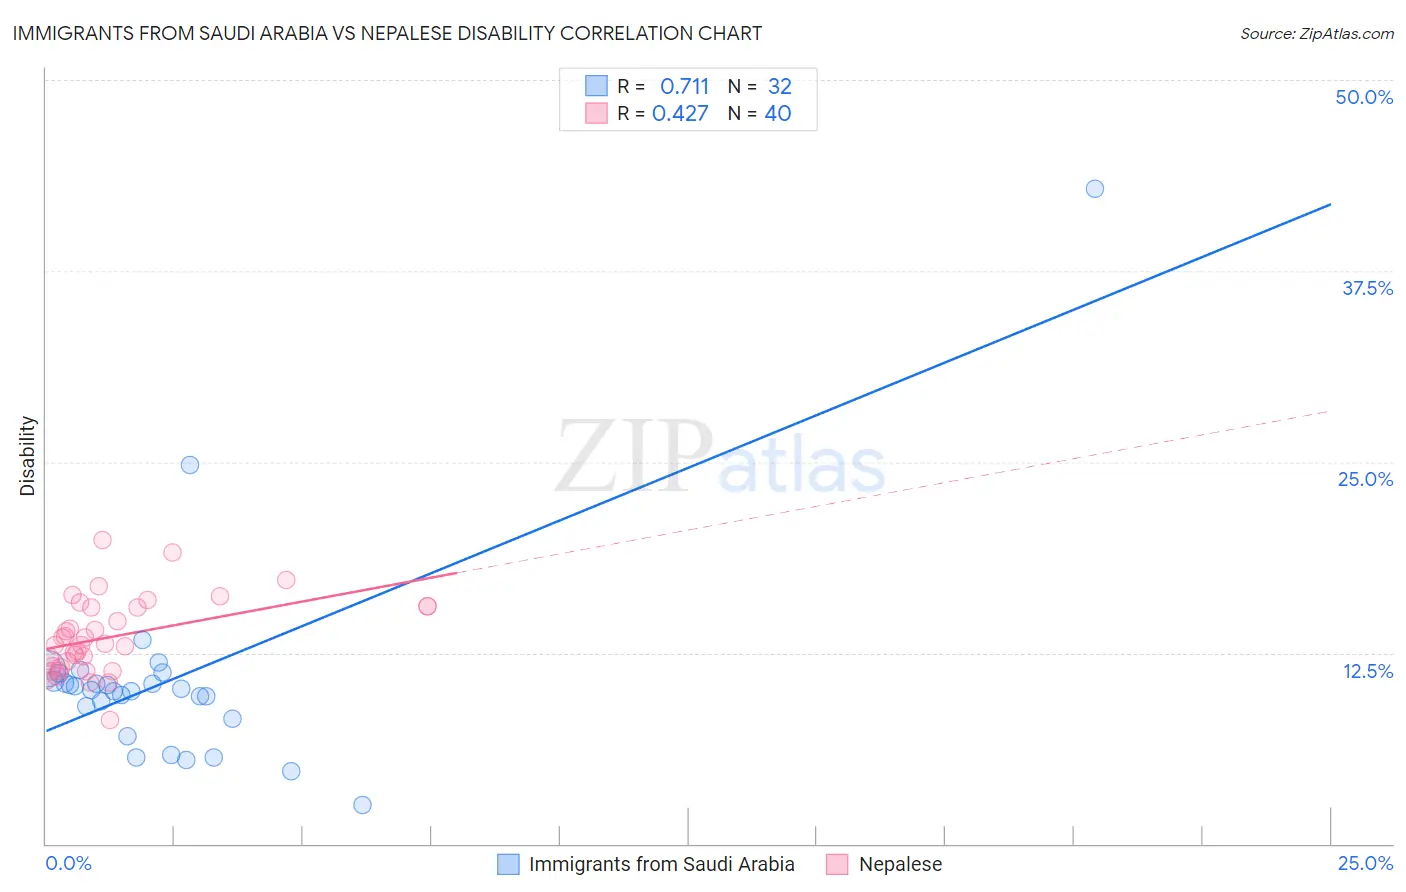
Immigrants from Saudi Arabia vs Nepalese Disability Correlation Chart
The statistical analysis conducted on geographies consisting of 164,295,639 people shows a strong positive correlation between the proportion of Immigrants from Saudi Arabia and percentage of population with a disability in the United States with a correlation coefficient (R) of 0.711 and weighted average of 10.9%. Similarly, the statistical analysis conducted on geographies consisting of 24,521,755 people shows a moderate positive correlation between the proportion of Nepalese and percentage of population with a disability in the United States with a correlation coefficient (R) of 0.427 and weighted average of 12.8%, a difference of 17.6%.
Disability Correlation Summary
| Measurement | Immigrants from Saudi Arabia | Nepalese |
| Minimum | 2.6% | 8.1% |
| Maximum | 42.9% | 19.9% |
| Range | 40.3% | 11.8% |
| Mean | 10.8% | 13.5% |
| Median | 10.1% | 13.1% |
| Interquartile 25% (IQ1) | 8.6% | 11.6% |
| Interquartile 75% (IQ3) | 10.9% | 15.5% |
| Interquartile Range (IQR) | 2.3% | 3.9% |
| Standard Deviation (Sample) | 6.9% | 2.5% |
| Standard Deviation (Population) | 6.8% | 2.4% |
Similar Demographics by Disability
Demographics Similar to Immigrants from Saudi Arabia by Disability
In terms of disability, the demographic groups most similar to Immigrants from Saudi Arabia are Vietnamese (10.9%, a difference of 0.0%), Peruvian (10.9%, a difference of 0.010%), Soviet Union (10.9%, a difference of 0.060%), South American (10.9%, a difference of 0.070%), and Immigrants from Spain (10.9%, a difference of 0.090%).
| Demographics | Rating | Rank | Disability |
| Israelis | 99.9 /100 | #43 | Exceptional 10.8% |
| Immigrants | Japan | 99.9 /100 | #44 | Exceptional 10.8% |
| Immigrants | Peru | 99.9 /100 | #45 | Exceptional 10.8% |
| Tongans | 99.9 /100 | #46 | Exceptional 10.8% |
| Taiwanese | 99.9 /100 | #47 | Exceptional 10.8% |
| Soviet Union | 99.9 /100 | #48 | Exceptional 10.9% |
| Vietnamese | 99.9 /100 | #49 | Exceptional 10.9% |
| Immigrants | Saudi Arabia | 99.9 /100 | #50 | Exceptional 10.9% |
| Peruvians | 99.8 /100 | #51 | Exceptional 10.9% |
| South Americans | 99.8 /100 | #52 | Exceptional 10.9% |
| Immigrants | Spain | 99.8 /100 | #53 | Exceptional 10.9% |
| Jordanians | 99.8 /100 | #54 | Exceptional 10.9% |
| Immigrants | El Salvador | 99.8 /100 | #55 | Exceptional 10.9% |
| Immigrants | Lithuania | 99.8 /100 | #56 | Exceptional 10.9% |
| Salvadorans | 99.8 /100 | #57 | Exceptional 10.9% |
Demographics Similar to Nepalese by Disability
In terms of disability, the demographic groups most similar to Nepalese are Sioux (12.8%, a difference of 0.080%), Hmong (12.8%, a difference of 0.23%), Dutch (12.8%, a difference of 0.28%), Finnish (12.7%, a difference of 0.43%), and German (12.8%, a difference of 0.45%).
| Demographics | Rating | Rank | Disability |
| Spaniards | 0.2 /100 | #267 | Tragic 12.5% |
| Bangladeshis | 0.1 /100 | #268 | Tragic 12.6% |
| Immigrants | Dominican Republic | 0.1 /100 | #269 | Tragic 12.6% |
| Portuguese | 0.1 /100 | #270 | Tragic 12.6% |
| Immigrants | Yemen | 0.1 /100 | #271 | Tragic 12.6% |
| Dominicans | 0.0 /100 | #272 | Tragic 12.7% |
| Finns | 0.0 /100 | #273 | Tragic 12.7% |
| Nepalese | 0.0 /100 | #274 | Tragic 12.8% |
| Sioux | 0.0 /100 | #275 | Tragic 12.8% |
| Hmong | 0.0 /100 | #276 | Tragic 12.8% |
| Dutch | 0.0 /100 | #277 | Tragic 12.8% |
| Germans | 0.0 /100 | #278 | Tragic 12.8% |
| Fijians | 0.0 /100 | #279 | Tragic 12.8% |
| Spanish | 0.0 /100 | #280 | Tragic 12.8% |
| Immigrants | Portugal | 0.0 /100 | #281 | Tragic 12.9% |