Latvian vs Nepalese Disability
COMPARE
Latvian
Nepalese
Disability
Disability Comparison
Latvians
Nepalese
11.4%
DISABILITY
89.8/ 100
METRIC RATING
130th/ 347
METRIC RANK
12.8%
DISABILITY
0.0/ 100
METRIC RATING
274th/ 347
METRIC RANK
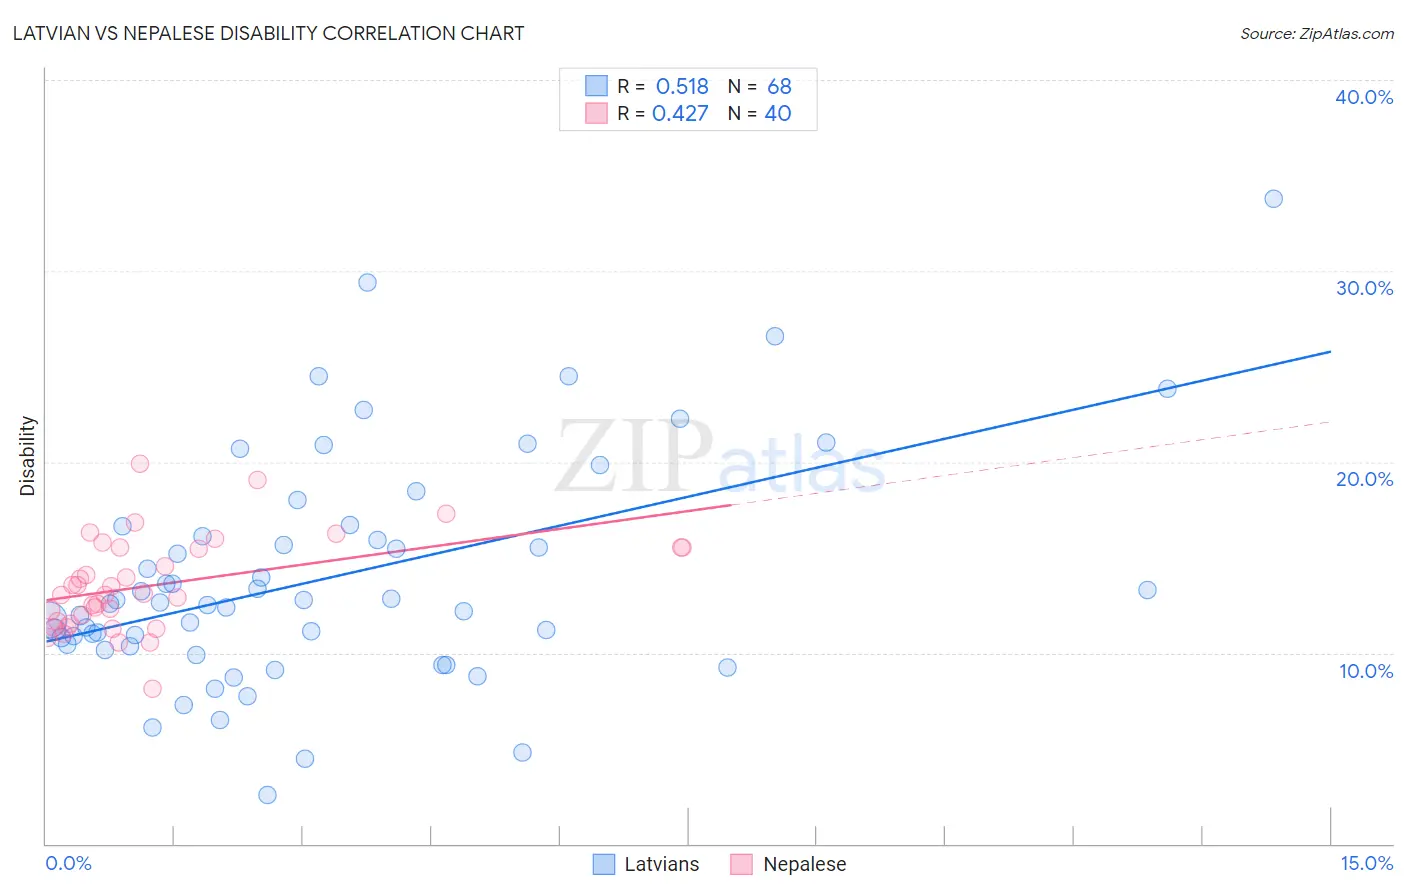
Latvian vs Nepalese Disability Correlation Chart
The statistical analysis conducted on geographies consisting of 220,718,032 people shows a substantial positive correlation between the proportion of Latvians and percentage of population with a disability in the United States with a correlation coefficient (R) of 0.518 and weighted average of 11.4%. Similarly, the statistical analysis conducted on geographies consisting of 24,521,755 people shows a moderate positive correlation between the proportion of Nepalese and percentage of population with a disability in the United States with a correlation coefficient (R) of 0.427 and weighted average of 12.8%, a difference of 11.8%.
Disability Correlation Summary
| Measurement | Latvian | Nepalese |
| Minimum | 2.6% | 8.1% |
| Maximum | 33.8% | 19.9% |
| Range | 31.2% | 11.8% |
| Mean | 13.9% | 13.5% |
| Median | 12.6% | 13.1% |
| Interquartile 25% (IQ1) | 10.4% | 11.6% |
| Interquartile 75% (IQ3) | 16.4% | 15.5% |
| Interquartile Range (IQR) | 6.0% | 3.9% |
| Standard Deviation (Sample) | 6.0% | 2.5% |
| Standard Deviation (Population) | 5.9% | 2.4% |
Similar Demographics by Disability
Demographics Similar to Latvians by Disability
In terms of disability, the demographic groups most similar to Latvians are Immigrants from Croatia (11.4%, a difference of 0.010%), Macedonian (11.4%, a difference of 0.060%), Immigrants from Italy (11.4%, a difference of 0.070%), Immigrants from Europe (11.4%, a difference of 0.070%), and Immigrants from Africa (11.4%, a difference of 0.070%).
| Demographics | Rating | Rank | Disability |
| South Africans | 92.3 /100 | #123 | Exceptional 11.4% |
| South American Indians | 92.2 /100 | #124 | Exceptional 11.4% |
| Costa Ricans | 91.9 /100 | #125 | Exceptional 11.4% |
| Immigrants | Latvia | 90.9 /100 | #126 | Exceptional 11.4% |
| Immigrants | Italy | 90.4 /100 | #127 | Exceptional 11.4% |
| Immigrants | Europe | 90.4 /100 | #128 | Exceptional 11.4% |
| Macedonians | 90.3 /100 | #129 | Exceptional 11.4% |
| Latvians | 89.8 /100 | #130 | Excellent 11.4% |
| Immigrants | Croatia | 89.8 /100 | #131 | Excellent 11.4% |
| Immigrants | Africa | 89.3 /100 | #132 | Excellent 11.4% |
| Arabs | 89.1 /100 | #133 | Excellent 11.4% |
| Immigrants | Guyana | 88.3 /100 | #134 | Excellent 11.4% |
| Ugandans | 87.9 /100 | #135 | Excellent 11.4% |
| Immigrants | St. Vincent and the Grenadines | 87.8 /100 | #136 | Excellent 11.4% |
| Kenyans | 87.1 /100 | #137 | Excellent 11.5% |
Demographics Similar to Nepalese by Disability
In terms of disability, the demographic groups most similar to Nepalese are Sioux (12.8%, a difference of 0.080%), Hmong (12.8%, a difference of 0.23%), Dutch (12.8%, a difference of 0.28%), Finnish (12.7%, a difference of 0.43%), and German (12.8%, a difference of 0.45%).
| Demographics | Rating | Rank | Disability |
| Spaniards | 0.2 /100 | #267 | Tragic 12.5% |
| Bangladeshis | 0.1 /100 | #268 | Tragic 12.6% |
| Immigrants | Dominican Republic | 0.1 /100 | #269 | Tragic 12.6% |
| Portuguese | 0.1 /100 | #270 | Tragic 12.6% |
| Immigrants | Yemen | 0.1 /100 | #271 | Tragic 12.6% |
| Dominicans | 0.0 /100 | #272 | Tragic 12.7% |
| Finns | 0.0 /100 | #273 | Tragic 12.7% |
| Nepalese | 0.0 /100 | #274 | Tragic 12.8% |
| Sioux | 0.0 /100 | #275 | Tragic 12.8% |
| Hmong | 0.0 /100 | #276 | Tragic 12.8% |
| Dutch | 0.0 /100 | #277 | Tragic 12.8% |
| Germans | 0.0 /100 | #278 | Tragic 12.8% |
| Fijians | 0.0 /100 | #279 | Tragic 12.8% |
| Spanish | 0.0 /100 | #280 | Tragic 12.8% |
| Immigrants | Portugal | 0.0 /100 | #281 | Tragic 12.9% |