Colville vs Nepalese Disability
COMPARE
Colville
Nepalese
Disability
Disability Comparison
Colville
Nepalese
15.8%
DISABILITY
0.0/ 100
METRIC RATING
344th/ 347
METRIC RANK
12.8%
DISABILITY
0.0/ 100
METRIC RATING
274th/ 347
METRIC RANK
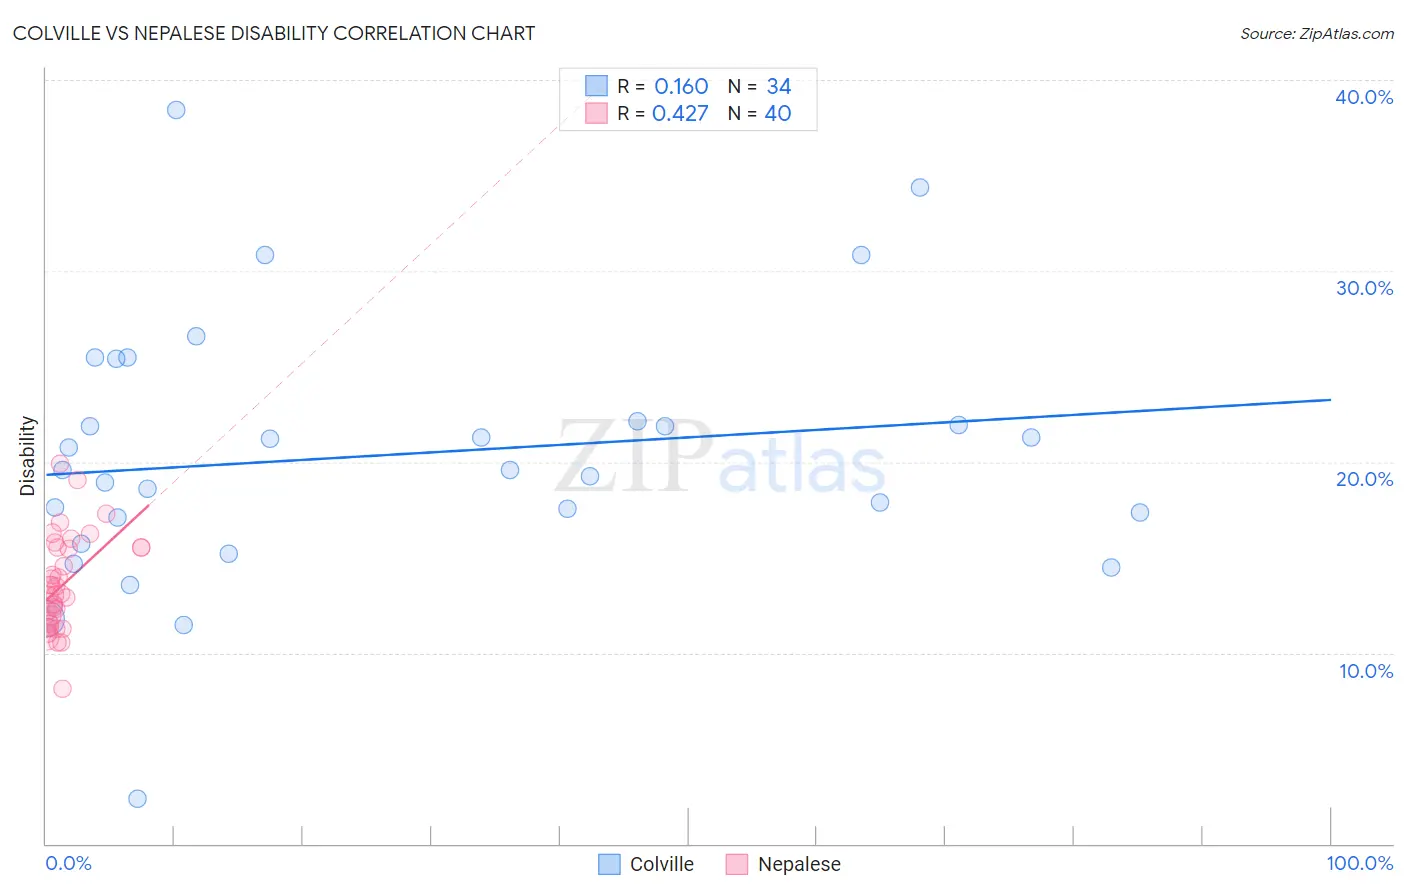
Colville vs Nepalese Disability Correlation Chart
The statistical analysis conducted on geographies consisting of 34,687,707 people shows a poor positive correlation between the proportion of Colville and percentage of population with a disability in the United States with a correlation coefficient (R) of 0.160 and weighted average of 15.8%. Similarly, the statistical analysis conducted on geographies consisting of 24,521,755 people shows a moderate positive correlation between the proportion of Nepalese and percentage of population with a disability in the United States with a correlation coefficient (R) of 0.427 and weighted average of 12.8%, a difference of 23.7%.
Disability Correlation Summary
| Measurement | Colville | Nepalese |
| Minimum | 2.4% | 8.1% |
| Maximum | 38.4% | 19.9% |
| Range | 36.0% | 11.8% |
| Mean | 20.4% | 13.5% |
| Median | 19.6% | 13.1% |
| Interquartile 25% (IQ1) | 17.1% | 11.6% |
| Interquartile 75% (IQ3) | 22.1% | 15.5% |
| Interquartile Range (IQR) | 5.0% | 3.9% |
| Standard Deviation (Sample) | 6.9% | 2.5% |
| Standard Deviation (Population) | 6.8% | 2.4% |
Similar Demographics by Disability
Demographics Similar to Colville by Disability
In terms of disability, the demographic groups most similar to Colville are Creek (15.6%, a difference of 1.2%), Kiowa (15.6%, a difference of 1.2%), Lumbee (15.5%, a difference of 1.7%), Puerto Rican (16.1%, a difference of 2.0%), and Tsimshian (16.1%, a difference of 2.2%).
| Demographics | Rating | Rank | Disability |
| Cajuns | 0.0 /100 | #333 | Tragic 14.6% |
| Yuman | 0.0 /100 | #334 | Tragic 14.6% |
| Tohono O'odham | 0.0 /100 | #335 | Tragic 14.8% |
| Cherokee | 0.0 /100 | #336 | Tragic 14.8% |
| Seminole | 0.0 /100 | #337 | Tragic 14.9% |
| Dutch West Indians | 0.0 /100 | #338 | Tragic 14.9% |
| Chickasaw | 0.0 /100 | #339 | Tragic 15.2% |
| Choctaw | 0.0 /100 | #340 | Tragic 15.4% |
| Lumbee | 0.0 /100 | #341 | Tragic 15.5% |
| Kiowa | 0.0 /100 | #342 | Tragic 15.6% |
| Creek | 0.0 /100 | #343 | Tragic 15.6% |
| Colville | 0.0 /100 | #344 | Tragic 15.8% |
| Puerto Ricans | 0.0 /100 | #345 | Tragic 16.1% |
| Tsimshian | 0.0 /100 | #346 | Tragic 16.1% |
| Houma | 0.0 /100 | #347 | Tragic 17.1% |
Demographics Similar to Nepalese by Disability
In terms of disability, the demographic groups most similar to Nepalese are Sioux (12.8%, a difference of 0.080%), Hmong (12.8%, a difference of 0.23%), Dutch (12.8%, a difference of 0.28%), Finnish (12.7%, a difference of 0.43%), and German (12.8%, a difference of 0.45%).
| Demographics | Rating | Rank | Disability |
| Spaniards | 0.2 /100 | #267 | Tragic 12.5% |
| Bangladeshis | 0.1 /100 | #268 | Tragic 12.6% |
| Immigrants | Dominican Republic | 0.1 /100 | #269 | Tragic 12.6% |
| Portuguese | 0.1 /100 | #270 | Tragic 12.6% |
| Immigrants | Yemen | 0.1 /100 | #271 | Tragic 12.6% |
| Dominicans | 0.0 /100 | #272 | Tragic 12.7% |
| Finns | 0.0 /100 | #273 | Tragic 12.7% |
| Nepalese | 0.0 /100 | #274 | Tragic 12.8% |
| Sioux | 0.0 /100 | #275 | Tragic 12.8% |
| Hmong | 0.0 /100 | #276 | Tragic 12.8% |
| Dutch | 0.0 /100 | #277 | Tragic 12.8% |
| Germans | 0.0 /100 | #278 | Tragic 12.8% |
| Fijians | 0.0 /100 | #279 | Tragic 12.8% |
| Spanish | 0.0 /100 | #280 | Tragic 12.8% |
| Immigrants | Portugal | 0.0 /100 | #281 | Tragic 12.9% |