Welsh vs Immigrants from Ukraine Self-Care Disability
COMPARE
Welsh
Immigrants from Ukraine
Self-Care Disability
Self-Care Disability Comparison
Welsh
Immigrants from Ukraine
2.5%
SELF-CARE DISABILITY
50.0/ 100
METRIC RATING
174th/ 347
METRIC RANK
2.7%
SELF-CARE DISABILITY
0.1/ 100
METRIC RATING
277th/ 347
METRIC RANK
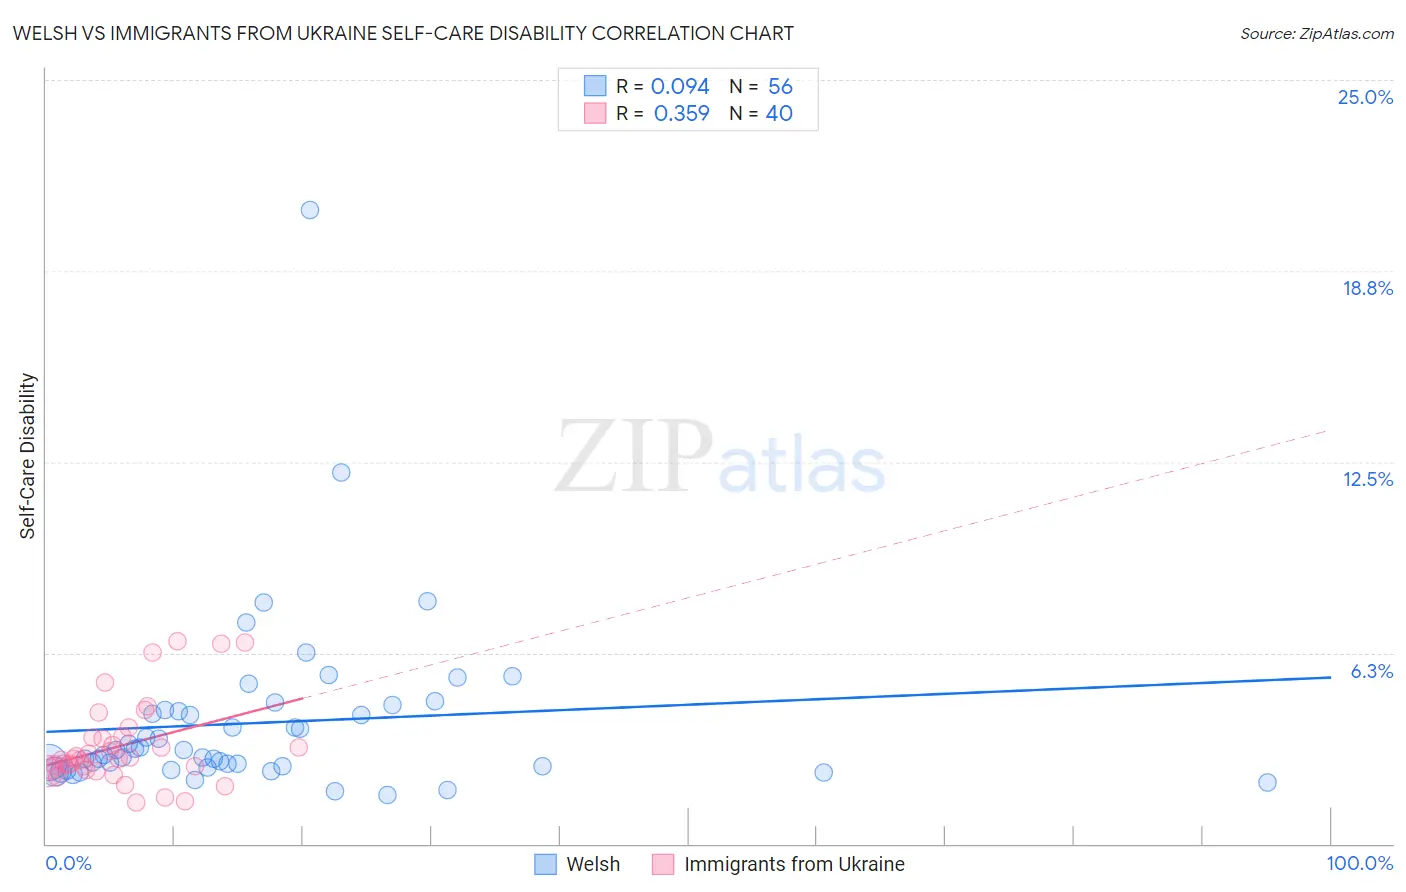
Welsh vs Immigrants from Ukraine Self-Care Disability Correlation Chart
The statistical analysis conducted on geographies consisting of 527,151,887 people shows a slight positive correlation between the proportion of Welsh and percentage of population with self-care disability in the United States with a correlation coefficient (R) of 0.094 and weighted average of 2.5%. Similarly, the statistical analysis conducted on geographies consisting of 289,474,241 people shows a mild positive correlation between the proportion of Immigrants from Ukraine and percentage of population with self-care disability in the United States with a correlation coefficient (R) of 0.359 and weighted average of 2.7%, a difference of 8.8%.
Self-Care Disability Correlation Summary
| Measurement | Welsh | Immigrants from Ukraine |
| Minimum | 1.6% | 1.3% |
| Maximum | 20.7% | 6.6% |
| Range | 19.1% | 5.3% |
| Mean | 4.0% | 3.2% |
| Median | 3.0% | 2.8% |
| Interquartile 25% (IQ1) | 2.5% | 2.4% |
| Interquartile 75% (IQ3) | 4.4% | 3.5% |
| Interquartile Range (IQR) | 1.8% | 1.1% |
| Standard Deviation (Sample) | 2.9% | 1.4% |
| Standard Deviation (Population) | 2.9% | 1.4% |
Similar Demographics by Self-Care Disability
Demographics Similar to Welsh by Self-Care Disability
In terms of self-care disability, the demographic groups most similar to Welsh are Immigrants from Bosnia and Herzegovina (2.5%, a difference of 0.020%), Immigrants from Afghanistan (2.5%, a difference of 0.11%), Immigrants from Burma/Myanmar (2.5%, a difference of 0.13%), Immigrants from Kazakhstan (2.5%, a difference of 0.16%), and Pennsylvania German (2.5%, a difference of 0.17%).
| Demographics | Rating | Rank | Self-Care Disability |
| Immigrants | Greece | 57.3 /100 | #167 | Average 2.5% |
| Ute | 57.1 /100 | #168 | Average 2.5% |
| Immigrants | Somalia | 55.9 /100 | #169 | Average 2.5% |
| Scottish | 54.3 /100 | #170 | Average 2.5% |
| Pennsylvania Germans | 53.5 /100 | #171 | Average 2.5% |
| Czechoslovakians | 53.5 /100 | #172 | Average 2.5% |
| Immigrants | Burma/Myanmar | 52.8 /100 | #173 | Average 2.5% |
| Welsh | 50.0 /100 | #174 | Average 2.5% |
| Immigrants | Bosnia and Herzegovina | 49.6 /100 | #175 | Average 2.5% |
| Immigrants | Afghanistan | 47.6 /100 | #176 | Average 2.5% |
| Immigrants | Kazakhstan | 46.7 /100 | #177 | Average 2.5% |
| English | 46.2 /100 | #178 | Average 2.5% |
| Hungarians | 45.5 /100 | #179 | Average 2.5% |
| Indonesians | 41.2 /100 | #180 | Average 2.5% |
| Ghanaians | 40.4 /100 | #181 | Average 2.5% |
Demographics Similar to Immigrants from Ukraine by Self-Care Disability
In terms of self-care disability, the demographic groups most similar to Immigrants from Ukraine are Japanese (2.7%, a difference of 0.060%), Ottawa (2.7%, a difference of 0.080%), Iroquois (2.7%, a difference of 0.18%), Yakama (2.7%, a difference of 0.19%), and Immigrants from Trinidad and Tobago (2.7%, a difference of 0.19%).
| Demographics | Rating | Rank | Self-Care Disability |
| Immigrants | Micronesia | 0.1 /100 | #270 | Tragic 2.7% |
| Trinidadians and Tobagonians | 0.1 /100 | #271 | Tragic 2.7% |
| Immigrants | Laos | 0.1 /100 | #272 | Tragic 2.7% |
| Mexicans | 0.1 /100 | #273 | Tragic 2.7% |
| Yakama | 0.1 /100 | #274 | Tragic 2.7% |
| Immigrants | Trinidad and Tobago | 0.1 /100 | #275 | Tragic 2.7% |
| Japanese | 0.1 /100 | #276 | Tragic 2.7% |
| Immigrants | Ukraine | 0.1 /100 | #277 | Tragic 2.7% |
| Ottawa | 0.1 /100 | #278 | Tragic 2.7% |
| Iroquois | 0.1 /100 | #279 | Tragic 2.7% |
| Hispanics or Latinos | 0.1 /100 | #280 | Tragic 2.7% |
| Immigrants | Iraq | 0.0 /100 | #281 | Tragic 2.7% |
| Apache | 0.0 /100 | #282 | Tragic 2.7% |
| Delaware | 0.0 /100 | #283 | Tragic 2.7% |
| Fijians | 0.0 /100 | #284 | Tragic 2.7% |