Scotch-Irish vs Colville Child Poverty Under the Age of 5
COMPARE
Scotch-Irish
Colville
Child Poverty Under the Age of 5
Child Poverty Under the Age of 5 Comparison
Scotch-Irish
Colville
18.2%
CHILD POVERTY UNDER THE AGE OF 5
9.8/ 100
METRIC RATING
208th/ 347
METRIC RANK
25.7%
CHILD POVERTY UNDER THE AGE OF 5
0.0/ 100
METRIC RATING
335th/ 347
METRIC RANK
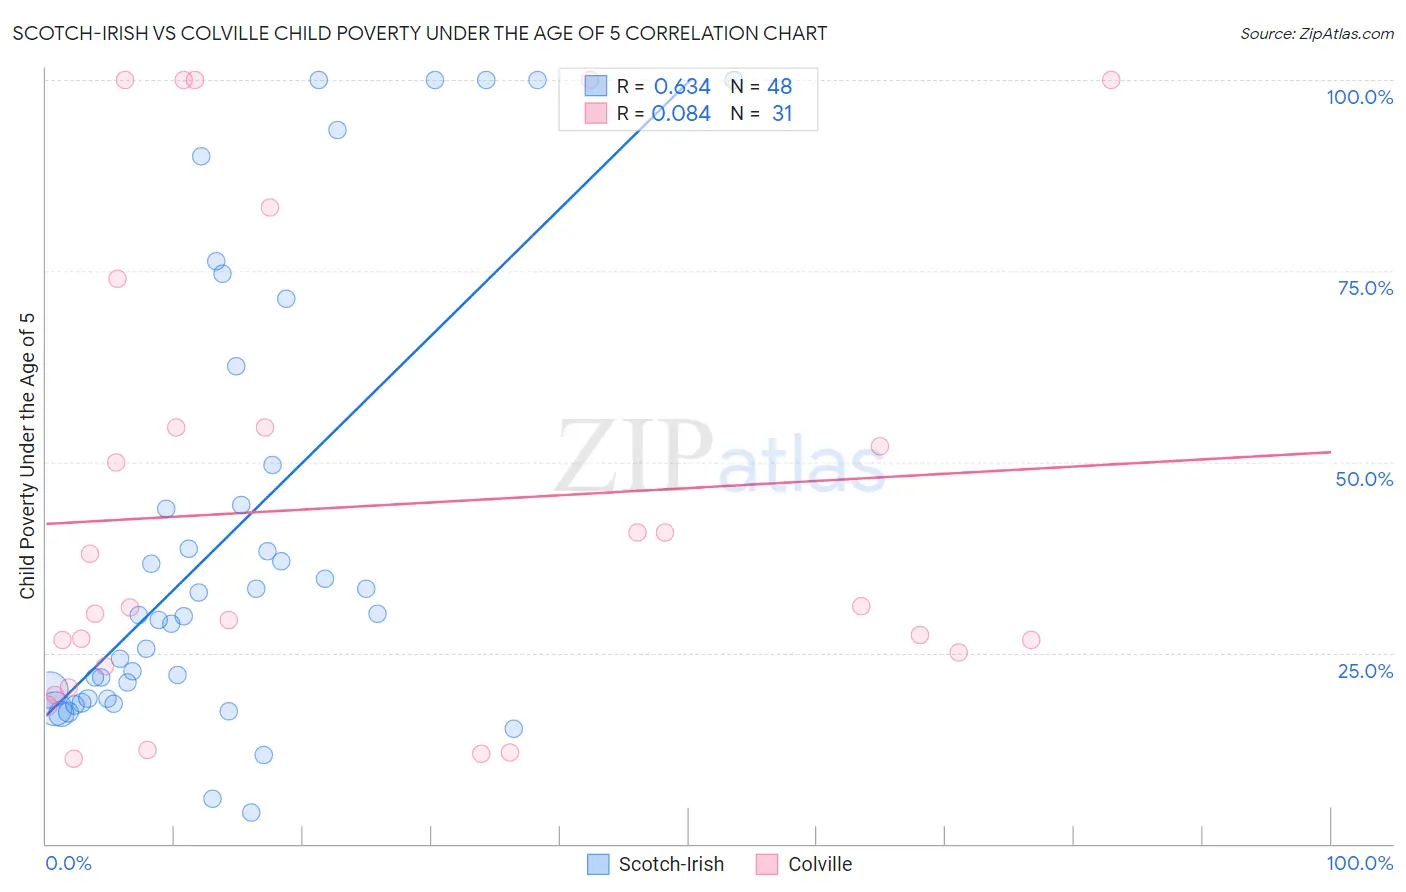
Scotch-Irish vs Colville Child Poverty Under the Age of 5 Correlation Chart
The statistical analysis conducted on geographies consisting of 512,287,895 people shows a significant positive correlation between the proportion of Scotch-Irish and poverty level among children under the age of 5 in the United States with a correlation coefficient (R) of 0.634 and weighted average of 18.2%. Similarly, the statistical analysis conducted on geographies consisting of 34,435,205 people shows a slight positive correlation between the proportion of Colville and poverty level among children under the age of 5 in the United States with a correlation coefficient (R) of 0.084 and weighted average of 25.7%, a difference of 40.9%.
Child Poverty Under the Age of 5 Correlation Summary
| Measurement | Scotch-Irish | Colville |
| Minimum | 4.1% | 11.1% |
| Maximum | 100.0% | 100.0% |
| Range | 95.9% | 88.9% |
| Mean | 39.9% | 44.2% |
| Median | 29.9% | 30.9% |
| Interquartile 25% (IQ1) | 19.0% | 23.2% |
| Interquartile 75% (IQ3) | 47.0% | 54.5% |
| Interquartile Range (IQR) | 28.1% | 31.3% |
| Standard Deviation (Sample) | 28.8% | 30.1% |
| Standard Deviation (Population) | 28.5% | 29.6% |
Similar Demographics by Child Poverty Under the Age of 5
Demographics Similar to Scotch-Irish by Child Poverty Under the Age of 5
In terms of child poverty under the age of 5, the demographic groups most similar to Scotch-Irish are Spanish (18.2%, a difference of 0.010%), Immigrants (18.2%, a difference of 0.020%), Panamanian (18.2%, a difference of 0.020%), Moroccan (18.2%, a difference of 0.11%), and Nepalese (18.3%, a difference of 0.32%).
| Demographics | Rating | Rank | Child Poverty Under the Age of 5 |
| Ugandans | 13.9 /100 | #201 | Poor 18.0% |
| Japanese | 13.8 /100 | #202 | Poor 18.1% |
| Immigrants | Cambodia | 13.7 /100 | #203 | Poor 18.1% |
| Immigrants | Eastern Africa | 13.4 /100 | #204 | Poor 18.1% |
| Spaniards | 12.8 /100 | #205 | Poor 18.1% |
| Whites/Caucasians | 12.6 /100 | #206 | Poor 18.1% |
| Immigrants | Immigrants | 9.9 /100 | #207 | Tragic 18.2% |
| Scotch-Irish | 9.8 /100 | #208 | Tragic 18.2% |
| Spanish | 9.8 /100 | #209 | Tragic 18.2% |
| Panamanians | 9.7 /100 | #210 | Tragic 18.2% |
| Moroccans | 9.4 /100 | #211 | Tragic 18.2% |
| Nepalese | 8.7 /100 | #212 | Tragic 18.3% |
| Immigrants | Thailand | 8.6 /100 | #213 | Tragic 18.3% |
| Malaysians | 6.5 /100 | #214 | Tragic 18.4% |
| Immigrants | Panama | 6.0 /100 | #215 | Tragic 18.5% |
Demographics Similar to Colville by Child Poverty Under the Age of 5
In terms of child poverty under the age of 5, the demographic groups most similar to Colville are Black/African American (25.7%, a difference of 0.0%), Native/Alaskan (25.6%, a difference of 0.50%), Apache (25.0%, a difference of 2.8%), Sioux (26.9%, a difference of 4.9%), and Kiowa (24.5%, a difference of 5.0%).
| Demographics | Rating | Rank | Child Poverty Under the Age of 5 |
| Immigrants | Dominican Republic | 0.0 /100 | #328 | Tragic 24.1% |
| Cajuns | 0.0 /100 | #329 | Tragic 24.1% |
| Creek | 0.0 /100 | #330 | Tragic 24.2% |
| Kiowa | 0.0 /100 | #331 | Tragic 24.5% |
| Apache | 0.0 /100 | #332 | Tragic 25.0% |
| Natives/Alaskans | 0.0 /100 | #333 | Tragic 25.6% |
| Blacks/African Americans | 0.0 /100 | #334 | Tragic 25.7% |
| Colville | 0.0 /100 | #335 | Tragic 25.7% |
| Sioux | 0.0 /100 | #336 | Tragic 26.9% |
| Pima | 0.0 /100 | #337 | Tragic 27.4% |
| Hopi | 0.0 /100 | #338 | Tragic 27.7% |
| Yup'ik | 0.0 /100 | #339 | Tragic 27.7% |
| Cheyenne | 0.0 /100 | #340 | Tragic 28.3% |
| Immigrants | Yemen | 0.0 /100 | #341 | Tragic 29.3% |
| Tohono O'odham | 0.0 /100 | #342 | Tragic 29.5% |