Scotch-Irish vs Cheyenne 8th Grade
COMPARE
Scotch-Irish
Cheyenne
8th Grade
8th Grade Comparison
Scotch-Irish
Cheyenne
97.1%
8TH GRADE
100.0/ 100
METRIC RATING
27th/ 347
METRIC RANK
96.1%
8TH GRADE
93.3/ 100
METRIC RATING
129th/ 347
METRIC RANK
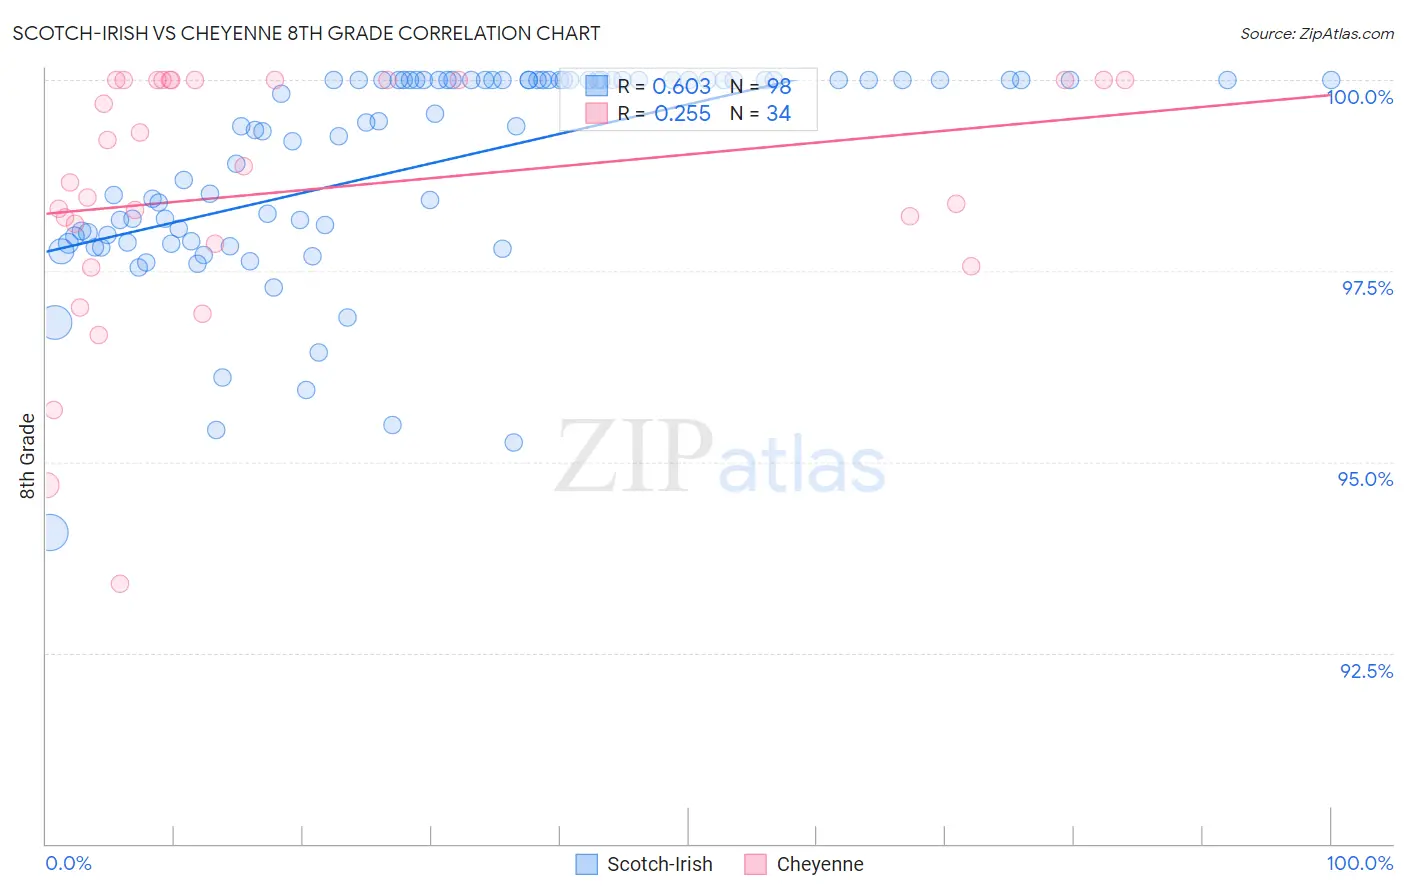
Scotch-Irish vs Cheyenne 8th Grade Correlation Chart
The statistical analysis conducted on geographies consisting of 548,777,407 people shows a significant positive correlation between the proportion of Scotch-Irish and percentage of population with at least 8th grade education in the United States with a correlation coefficient (R) of 0.603 and weighted average of 97.1%. Similarly, the statistical analysis conducted on geographies consisting of 80,719,411 people shows a weak positive correlation between the proportion of Cheyenne and percentage of population with at least 8th grade education in the United States with a correlation coefficient (R) of 0.255 and weighted average of 96.1%, a difference of 1.0%.
8th Grade Correlation Summary
| Measurement | Scotch-Irish | Cheyenne |
| Minimum | 94.1% | 93.4% |
| Maximum | 100.0% | 100.0% |
| Range | 5.9% | 6.6% |
| Mean | 98.9% | 98.6% |
| Median | 99.4% | 98.8% |
| Interquartile 25% (IQ1) | 97.9% | 97.8% |
| Interquartile 75% (IQ3) | 100.0% | 100.0% |
| Interquartile Range (IQR) | 2.1% | 2.2% |
| Standard Deviation (Sample) | 1.4% | 1.7% |
| Standard Deviation (Population) | 1.4% | 1.6% |
Similar Demographics by 8th Grade
Demographics Similar to Scotch-Irish by 8th Grade
In terms of 8th grade, the demographic groups most similar to Scotch-Irish are Italian (97.1%, a difference of 0.010%), European (97.1%, a difference of 0.010%), Czech (97.1%, a difference of 0.020%), French (97.1%, a difference of 0.020%), and Scandinavian (97.2%, a difference of 0.030%).
| Demographics | Rating | Rank | 8th Grade |
| Croatians | 100.0 /100 | #20 | Exceptional 97.2% |
| Danes | 100.0 /100 | #21 | Exceptional 97.2% |
| Welsh | 100.0 /100 | #22 | Exceptional 97.2% |
| French Canadians | 100.0 /100 | #23 | Exceptional 97.2% |
| Scandinavians | 100.0 /100 | #24 | Exceptional 97.2% |
| Czechs | 100.0 /100 | #25 | Exceptional 97.1% |
| French | 100.0 /100 | #26 | Exceptional 97.1% |
| Scotch-Irish | 100.0 /100 | #27 | Exceptional 97.1% |
| Italians | 100.0 /100 | #28 | Exceptional 97.1% |
| Europeans | 100.0 /100 | #29 | Exceptional 97.1% |
| Sioux | 100.0 /100 | #30 | Exceptional 97.1% |
| Chippewa | 100.0 /100 | #31 | Exceptional 97.1% |
| Yup'ik | 100.0 /100 | #32 | Exceptional 97.0% |
| Swiss | 100.0 /100 | #33 | Exceptional 97.0% |
| Luxembourgers | 100.0 /100 | #34 | Exceptional 97.0% |
Demographics Similar to Cheyenne by 8th Grade
In terms of 8th grade, the demographic groups most similar to Cheyenne are Immigrants from Bosnia and Herzegovina (96.2%, a difference of 0.010%), Immigrants from Romania (96.2%, a difference of 0.020%), Choctaw (96.2%, a difference of 0.020%), Immigrants from Serbia (96.2%, a difference of 0.020%), and Soviet Union (96.1%, a difference of 0.020%).
| Demographics | Rating | Rank | 8th Grade |
| Immigrants | Europe | 95.3 /100 | #122 | Exceptional 96.2% |
| Filipinos | 94.6 /100 | #123 | Exceptional 96.2% |
| Palestinians | 94.6 /100 | #124 | Exceptional 96.2% |
| Immigrants | Romania | 94.1 /100 | #125 | Exceptional 96.2% |
| Choctaw | 94.0 /100 | #126 | Exceptional 96.2% |
| Immigrants | Serbia | 94.0 /100 | #127 | Exceptional 96.2% |
| Immigrants | Bosnia and Herzegovina | 93.9 /100 | #128 | Exceptional 96.2% |
| Cheyenne | 93.3 /100 | #129 | Exceptional 96.1% |
| Soviet Union | 92.6 /100 | #130 | Exceptional 96.1% |
| Pueblo | 92.3 /100 | #131 | Exceptional 96.1% |
| Immigrants | Kuwait | 92.2 /100 | #132 | Exceptional 96.1% |
| Immigrants | Turkey | 91.7 /100 | #133 | Exceptional 96.1% |
| Immigrants | Hungary | 91.5 /100 | #134 | Exceptional 96.1% |
| Basques | 91.5 /100 | #135 | Exceptional 96.1% |
| Jordanians | 91.3 /100 | #136 | Exceptional 96.1% |