Scotch-Irish vs Argentinean Unemployment Among Ages 25 to 29 years
COMPARE
Scotch-Irish
Argentinean
Unemployment Among Ages 25 to 29 years
Unemployment Among Ages 25 to 29 years Comparison
Scotch-Irish
Argentineans
6.8%
UNEMPLOYMENT AMONG AGES 25 TO 29 YEARS
20.0/ 100
METRIC RATING
204th/ 347
METRIC RANK
6.7%
UNEMPLOYMENT AMONG AGES 25 TO 29 YEARS
32.1/ 100
METRIC RATING
189th/ 347
METRIC RANK
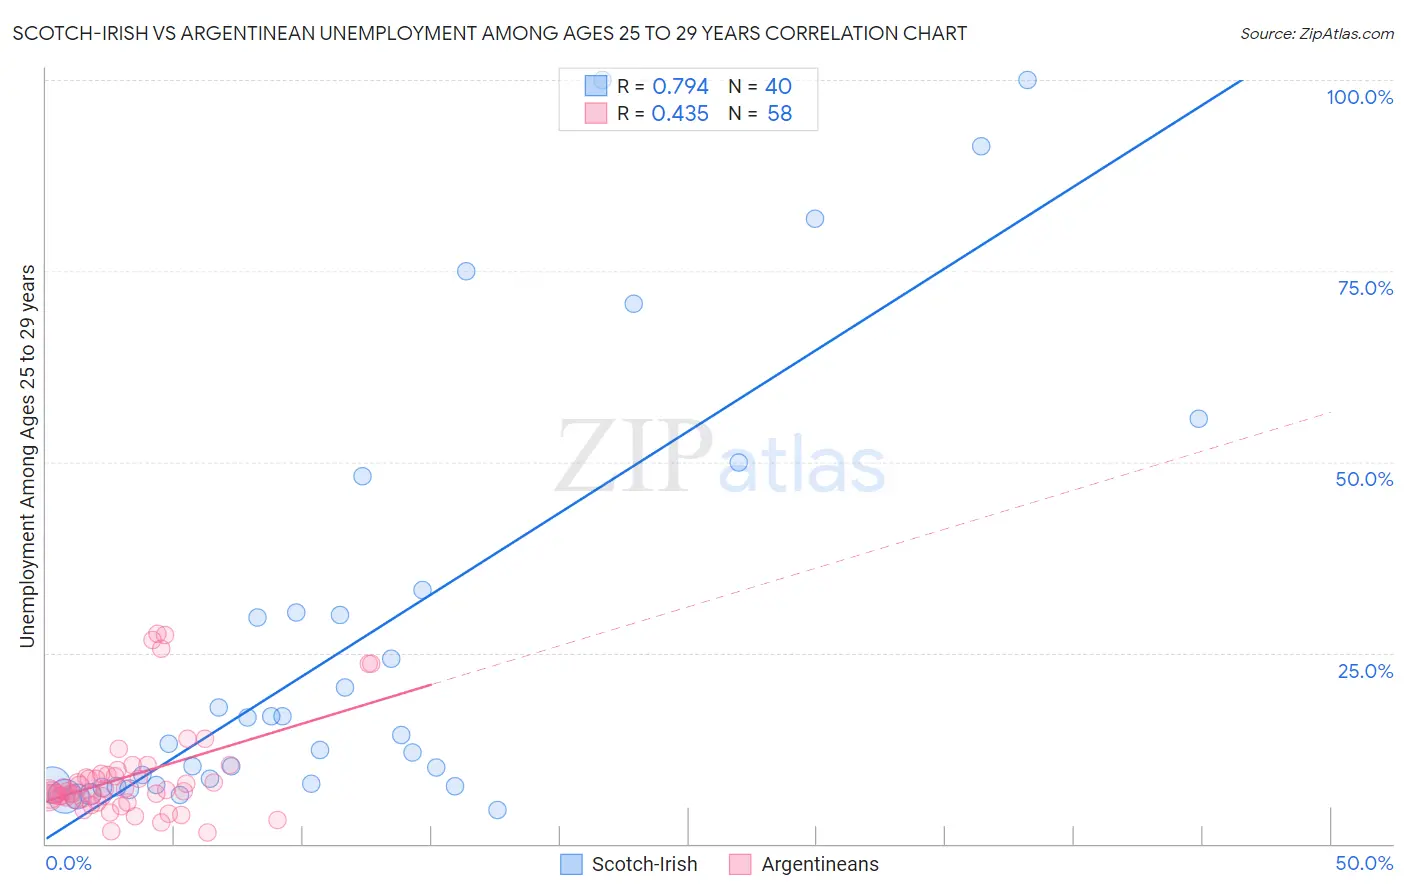
Scotch-Irish vs Argentinean Unemployment Among Ages 25 to 29 years Correlation Chart
The statistical analysis conducted on geographies consisting of 489,887,362 people shows a strong positive correlation between the proportion of Scotch-Irish and unemployment rate among population between the ages 25 and 29 in the United States with a correlation coefficient (R) of 0.794 and weighted average of 6.8%. Similarly, the statistical analysis conducted on geographies consisting of 287,291,410 people shows a moderate positive correlation between the proportion of Argentineans and unemployment rate among population between the ages 25 and 29 in the United States with a correlation coefficient (R) of 0.435 and weighted average of 6.7%, a difference of 0.98%.
Unemployment Among Ages 25 to 29 years Correlation Summary
| Measurement | Scotch-Irish | Argentinean |
| Minimum | 4.5% | 1.4% |
| Maximum | 100.0% | 27.5% |
| Range | 95.5% | 26.1% |
| Mean | 27.2% | 8.9% |
| Median | 13.7% | 6.9% |
| Interquartile 25% (IQ1) | 7.7% | 5.9% |
| Interquartile 75% (IQ3) | 31.8% | 9.0% |
| Interquartile Range (IQR) | 24.1% | 3.1% |
| Standard Deviation (Sample) | 28.4% | 6.3% |
| Standard Deviation (Population) | 28.1% | 6.2% |
Demographics Similar to Scotch-Irish and Argentineans by Unemployment Among Ages 25 to 29 years
In terms of unemployment among ages 25 to 29 years, the demographic groups most similar to Scotch-Irish are Immigrants from England (6.8%, a difference of 0.010%), Ugandan (6.8%, a difference of 0.020%), Immigrants from Norway (6.8%, a difference of 0.12%), Immigrants from Argentina (6.8%, a difference of 0.15%), and Basque (6.8%, a difference of 0.23%). Similarly, the demographic groups most similar to Argentineans are Irish (6.7%, a difference of 0.050%), Immigrants from South America (6.7%, a difference of 0.060%), Immigrants from Iran (6.7%, a difference of 0.16%), Korean (6.7%, a difference of 0.20%), and Chickasaw (6.7%, a difference of 0.25%).
| Demographics | Rating | Rank | Unemployment Among Ages 25 to 29 years |
| Immigrants | Iran | 34.4 /100 | #186 | Fair 6.7% |
| Immigrants | South America | 33.0 /100 | #187 | Fair 6.7% |
| Irish | 32.8 /100 | #188 | Fair 6.7% |
| Argentineans | 32.1 /100 | #189 | Fair 6.7% |
| Koreans | 29.3 /100 | #190 | Fair 6.7% |
| Chickasaw | 28.7 /100 | #191 | Fair 6.7% |
| Immigrants | Ukraine | 28.6 /100 | #192 | Fair 6.7% |
| Alsatians | 28.1 /100 | #193 | Fair 6.7% |
| Immigrants | Greece | 28.0 /100 | #194 | Fair 6.7% |
| Immigrants | Western Asia | 27.3 /100 | #195 | Fair 6.7% |
| Hungarians | 26.8 /100 | #196 | Fair 6.8% |
| Italians | 26.5 /100 | #197 | Fair 6.8% |
| Immigrants | Southern Europe | 24.6 /100 | #198 | Fair 6.8% |
| Guamanians/Chamorros | 24.3 /100 | #199 | Fair 6.8% |
| South American Indians | 23.3 /100 | #200 | Fair 6.8% |
| Basques | 22.5 /100 | #201 | Fair 6.8% |
| Immigrants | Argentina | 21.6 /100 | #202 | Fair 6.8% |
| Immigrants | Norway | 21.2 /100 | #203 | Fair 6.8% |
| Scotch-Irish | 20.0 /100 | #204 | Poor 6.8% |
| Immigrants | England | 19.8 /100 | #205 | Poor 6.8% |
| Ugandans | 19.8 /100 | #206 | Poor 6.8% |