Ottawa vs Argentinean Disability Age 65 to 74
COMPARE
Ottawa
Argentinean
Disability Age 65 to 74
Disability Age 65 to 74 Comparison
Ottawa
Argentineans
25.6%
DISABILITY AGE 65 TO 74
0.1/ 100
METRIC RATING
267th/ 347
METRIC RANK
21.2%
DISABILITY AGE 65 TO 74
99.8/ 100
METRIC RATING
39th/ 347
METRIC RANK
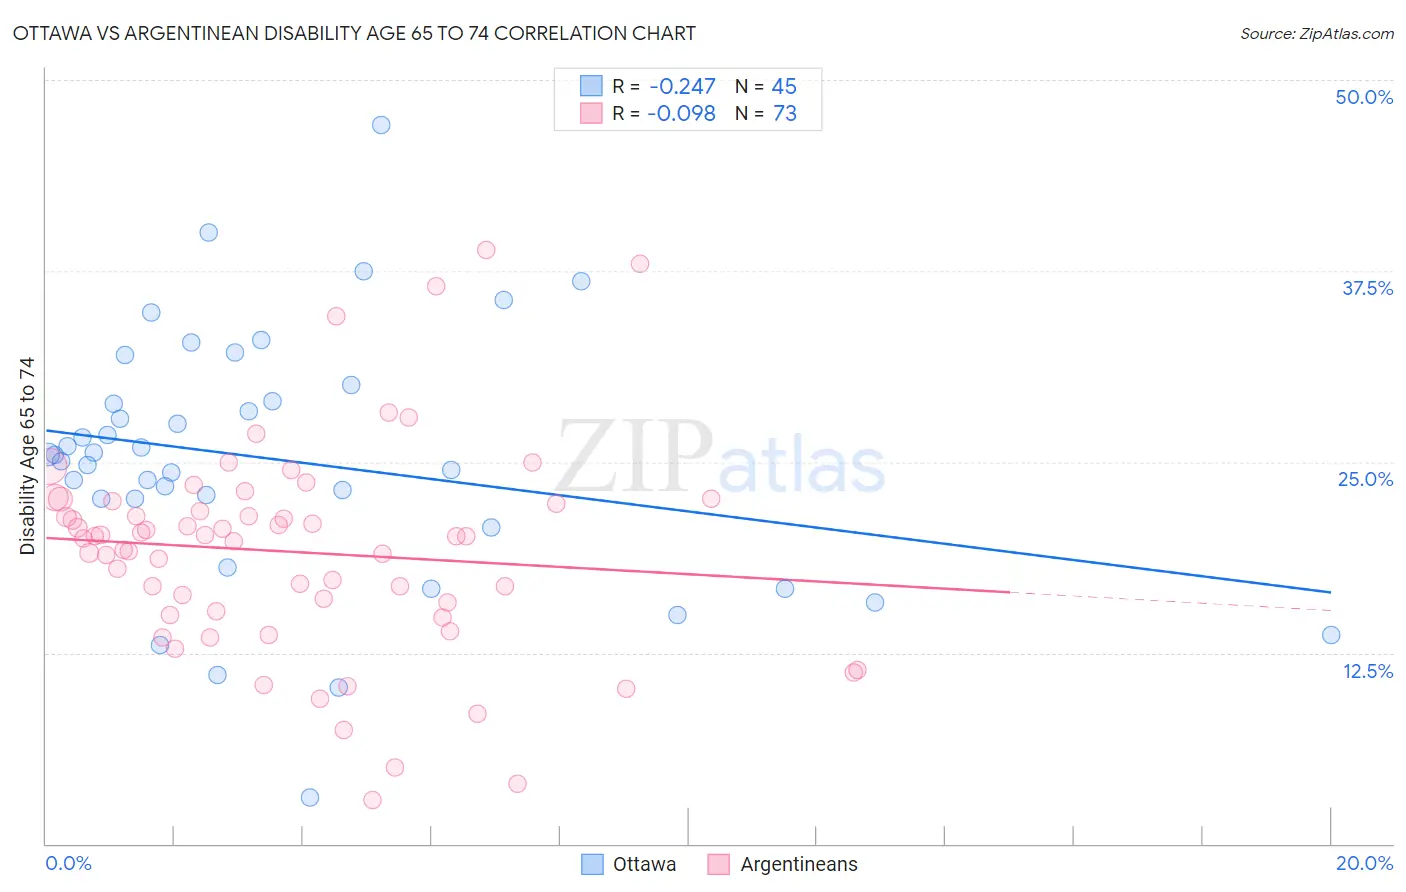
Ottawa vs Argentinean Disability Age 65 to 74 Correlation Chart
The statistical analysis conducted on geographies consisting of 49,922,669 people shows a weak negative correlation between the proportion of Ottawa and percentage of population with a disability between the ages 65 and 75 in the United States with a correlation coefficient (R) of -0.247 and weighted average of 25.6%. Similarly, the statistical analysis conducted on geographies consisting of 296,790,754 people shows a slight negative correlation between the proportion of Argentineans and percentage of population with a disability between the ages 65 and 75 in the United States with a correlation coefficient (R) of -0.098 and weighted average of 21.2%, a difference of 20.8%.
Disability Age 65 to 74 Correlation Summary
| Measurement | Ottawa | Argentinean |
| Minimum | 3.0% | 2.9% |
| Maximum | 47.1% | 38.9% |
| Range | 44.0% | 36.0% |
| Mean | 25.1% | 19.1% |
| Median | 25.5% | 20.1% |
| Interquartile 25% (IQ1) | 21.6% | 15.1% |
| Interquartile 75% (IQ3) | 29.5% | 22.4% |
| Interquartile Range (IQR) | 7.9% | 7.3% |
| Standard Deviation (Sample) | 8.4% | 6.9% |
| Standard Deviation (Population) | 8.3% | 6.9% |
Similar Demographics by Disability Age 65 to 74
Demographics Similar to Ottawa by Disability Age 65 to 74
In terms of disability age 65 to 74, the demographic groups most similar to Ottawa are Liberian (25.6%, a difference of 0.10%), Immigrants from Latin America (25.6%, a difference of 0.14%), Hmong (25.7%, a difference of 0.22%), Guatemalan (25.5%, a difference of 0.23%), and Hawaiian (25.5%, a difference of 0.27%).
| Demographics | Rating | Rank | Disability Age 65 to 74 |
| Malaysians | 0.2 /100 | #260 | Tragic 25.4% |
| Cape Verdeans | 0.2 /100 | #261 | Tragic 25.4% |
| Samoans | 0.2 /100 | #262 | Tragic 25.4% |
| Iroquois | 0.2 /100 | #263 | Tragic 25.4% |
| Hawaiians | 0.2 /100 | #264 | Tragic 25.5% |
| Guatemalans | 0.2 /100 | #265 | Tragic 25.5% |
| Immigrants | Latin America | 0.1 /100 | #266 | Tragic 25.6% |
| Ottawa | 0.1 /100 | #267 | Tragic 25.6% |
| Liberians | 0.1 /100 | #268 | Tragic 25.6% |
| Hmong | 0.1 /100 | #269 | Tragic 25.7% |
| Immigrants | Guatemala | 0.1 /100 | #270 | Tragic 25.7% |
| Immigrants | Liberia | 0.1 /100 | #271 | Tragic 25.7% |
| Immigrants | Dominica | 0.1 /100 | #272 | Tragic 25.7% |
| Japanese | 0.1 /100 | #273 | Tragic 25.7% |
| Americans | 0.1 /100 | #274 | Tragic 25.8% |
Demographics Similar to Argentineans by Disability Age 65 to 74
In terms of disability age 65 to 74, the demographic groups most similar to Argentineans are Latvian (21.2%, a difference of 0.16%), Russian (21.2%, a difference of 0.18%), Israeli (21.2%, a difference of 0.19%), Immigrants from Austria (21.2%, a difference of 0.23%), and Immigrants from Switzerland (21.1%, a difference of 0.29%).
| Demographics | Rating | Rank | Disability Age 65 to 74 |
| Turks | 99.9 /100 | #32 | Exceptional 21.0% |
| Immigrants | Argentina | 99.9 /100 | #33 | Exceptional 21.1% |
| Immigrants | Sri Lanka | 99.9 /100 | #34 | Exceptional 21.1% |
| Bulgarians | 99.9 /100 | #35 | Exceptional 21.1% |
| Immigrants | Switzerland | 99.8 /100 | #36 | Exceptional 21.1% |
| Israelis | 99.8 /100 | #37 | Exceptional 21.2% |
| Russians | 99.8 /100 | #38 | Exceptional 21.2% |
| Argentineans | 99.8 /100 | #39 | Exceptional 21.2% |
| Latvians | 99.8 /100 | #40 | Exceptional 21.2% |
| Immigrants | Austria | 99.8 /100 | #41 | Exceptional 21.2% |
| Macedonians | 99.7 /100 | #42 | Exceptional 21.3% |
| Immigrants | Croatia | 99.7 /100 | #43 | Exceptional 21.3% |
| Estonians | 99.7 /100 | #44 | Exceptional 21.4% |
| Asians | 99.7 /100 | #45 | Exceptional 21.4% |
| Immigrants | Turkey | 99.7 /100 | #46 | Exceptional 21.4% |