Immigrants from Cameroon vs Argentinean Disability Age 65 to 74
COMPARE
Immigrants from Cameroon
Argentinean
Disability Age 65 to 74
Disability Age 65 to 74 Comparison
Immigrants from Cameroon
Argentineans
23.1%
DISABILITY AGE 65 TO 74
63.8/ 100
METRIC RATING
161st/ 347
METRIC RANK
21.2%
DISABILITY AGE 65 TO 74
99.8/ 100
METRIC RATING
39th/ 347
METRIC RANK
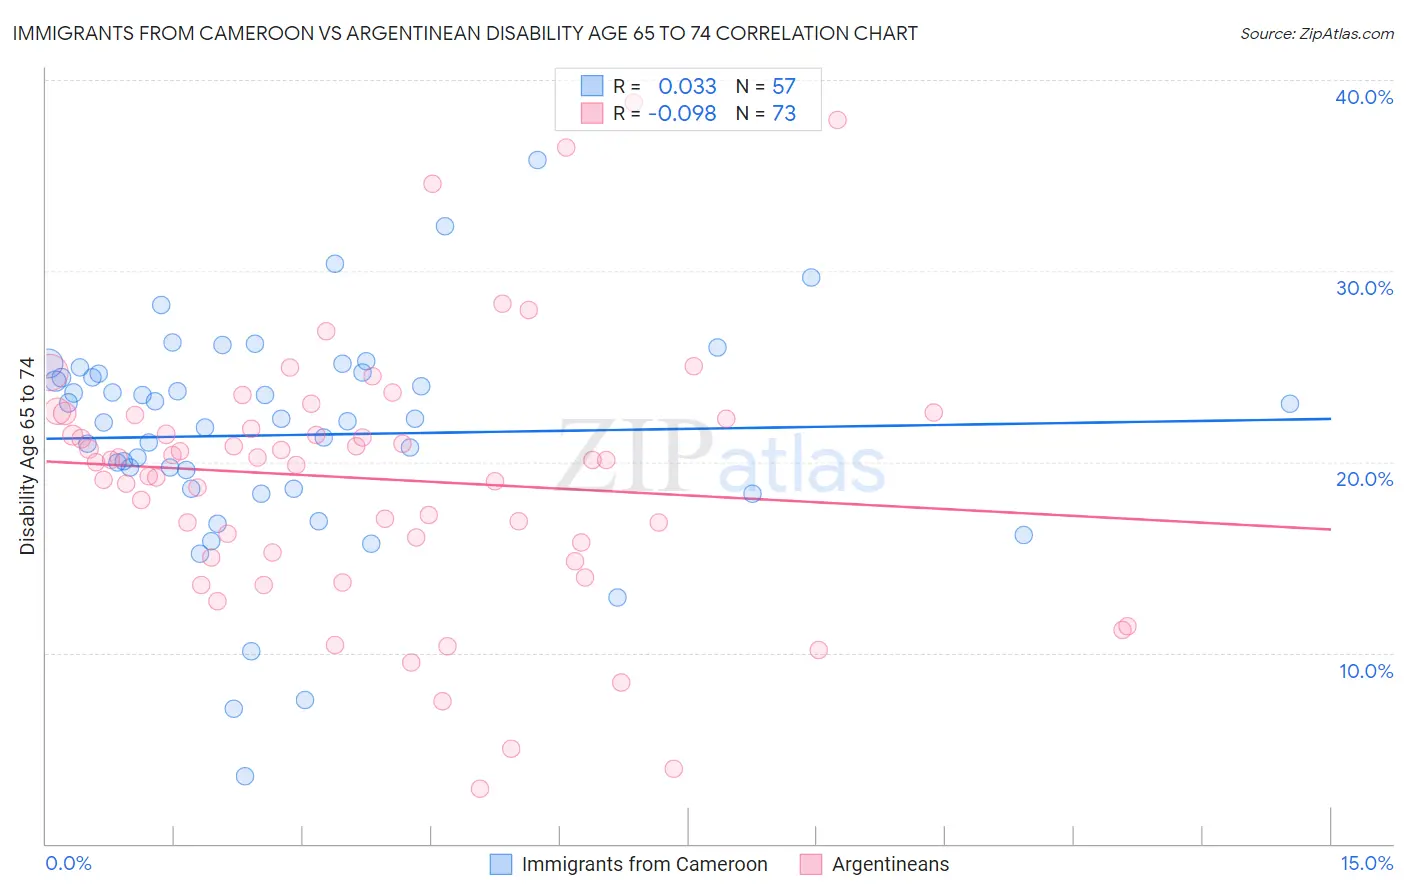
Immigrants from Cameroon vs Argentinean Disability Age 65 to 74 Correlation Chart
The statistical analysis conducted on geographies consisting of 130,578,775 people shows no correlation between the proportion of Immigrants from Cameroon and percentage of population with a disability between the ages 65 and 75 in the United States with a correlation coefficient (R) of 0.033 and weighted average of 23.1%. Similarly, the statistical analysis conducted on geographies consisting of 296,790,754 people shows a slight negative correlation between the proportion of Argentineans and percentage of population with a disability between the ages 65 and 75 in the United States with a correlation coefficient (R) of -0.098 and weighted average of 21.2%, a difference of 9.2%.
Disability Age 65 to 74 Correlation Summary
| Measurement | Immigrants from Cameroon | Argentinean |
| Minimum | 3.5% | 2.9% |
| Maximum | 35.8% | 38.9% |
| Range | 32.3% | 36.0% |
| Mean | 21.4% | 19.1% |
| Median | 22.3% | 20.1% |
| Interquartile 25% (IQ1) | 18.6% | 15.1% |
| Interquartile 75% (IQ3) | 24.7% | 22.4% |
| Interquartile Range (IQR) | 6.1% | 7.3% |
| Standard Deviation (Sample) | 5.8% | 6.9% |
| Standard Deviation (Population) | 5.8% | 6.9% |
Similar Demographics by Disability Age 65 to 74
Demographics Similar to Immigrants from Cameroon by Disability Age 65 to 74
In terms of disability age 65 to 74, the demographic groups most similar to Immigrants from Cameroon are Korean (23.1%, a difference of 0.030%), South American Indian (23.1%, a difference of 0.11%), European (23.2%, a difference of 0.16%), Immigrants from Philippines (23.2%, a difference of 0.16%), and Sierra Leonean (23.2%, a difference of 0.18%).
| Demographics | Rating | Rank | Disability Age 65 to 74 |
| Sri Lankans | 74.0 /100 | #154 | Good 23.0% |
| British | 73.9 /100 | #155 | Good 23.0% |
| Immigrants | Western Asia | 73.8 /100 | #156 | Good 23.0% |
| Czechoslovakians | 72.4 /100 | #157 | Good 23.0% |
| Immigrants | Vietnam | 69.1 /100 | #158 | Good 23.1% |
| South American Indians | 65.5 /100 | #159 | Good 23.1% |
| Koreans | 64.2 /100 | #160 | Good 23.1% |
| Immigrants | Cameroon | 63.8 /100 | #161 | Good 23.1% |
| Europeans | 61.2 /100 | #162 | Good 23.2% |
| Immigrants | Philippines | 61.1 /100 | #163 | Good 23.2% |
| Sierra Leoneans | 60.9 /100 | #164 | Good 23.2% |
| Vietnamese | 60.8 /100 | #165 | Good 23.2% |
| Immigrants | Afghanistan | 60.5 /100 | #166 | Good 23.2% |
| Immigrants | Bosnia and Herzegovina | 57.6 /100 | #167 | Average 23.2% |
| Pakistanis | 57.0 /100 | #168 | Average 23.2% |
Demographics Similar to Argentineans by Disability Age 65 to 74
In terms of disability age 65 to 74, the demographic groups most similar to Argentineans are Latvian (21.2%, a difference of 0.16%), Russian (21.2%, a difference of 0.18%), Israeli (21.2%, a difference of 0.19%), Immigrants from Austria (21.2%, a difference of 0.23%), and Immigrants from Switzerland (21.1%, a difference of 0.29%).
| Demographics | Rating | Rank | Disability Age 65 to 74 |
| Turks | 99.9 /100 | #32 | Exceptional 21.0% |
| Immigrants | Argentina | 99.9 /100 | #33 | Exceptional 21.1% |
| Immigrants | Sri Lanka | 99.9 /100 | #34 | Exceptional 21.1% |
| Bulgarians | 99.9 /100 | #35 | Exceptional 21.1% |
| Immigrants | Switzerland | 99.8 /100 | #36 | Exceptional 21.1% |
| Israelis | 99.8 /100 | #37 | Exceptional 21.2% |
| Russians | 99.8 /100 | #38 | Exceptional 21.2% |
| Argentineans | 99.8 /100 | #39 | Exceptional 21.2% |
| Latvians | 99.8 /100 | #40 | Exceptional 21.2% |
| Immigrants | Austria | 99.8 /100 | #41 | Exceptional 21.2% |
| Macedonians | 99.7 /100 | #42 | Exceptional 21.3% |
| Immigrants | Croatia | 99.7 /100 | #43 | Exceptional 21.3% |
| Estonians | 99.7 /100 | #44 | Exceptional 21.4% |
| Asians | 99.7 /100 | #45 | Exceptional 21.4% |
| Immigrants | Turkey | 99.7 /100 | #46 | Exceptional 21.4% |