Immigrants from Pakistan vs Argentinean Disability Age 65 to 74
COMPARE
Immigrants from Pakistan
Argentinean
Disability Age 65 to 74
Disability Age 65 to 74 Comparison
Immigrants from Pakistan
Argentineans
21.5%
DISABILITY AGE 65 TO 74
99.5/ 100
METRIC RATING
58th/ 347
METRIC RANK
21.2%
DISABILITY AGE 65 TO 74
99.8/ 100
METRIC RATING
39th/ 347
METRIC RANK
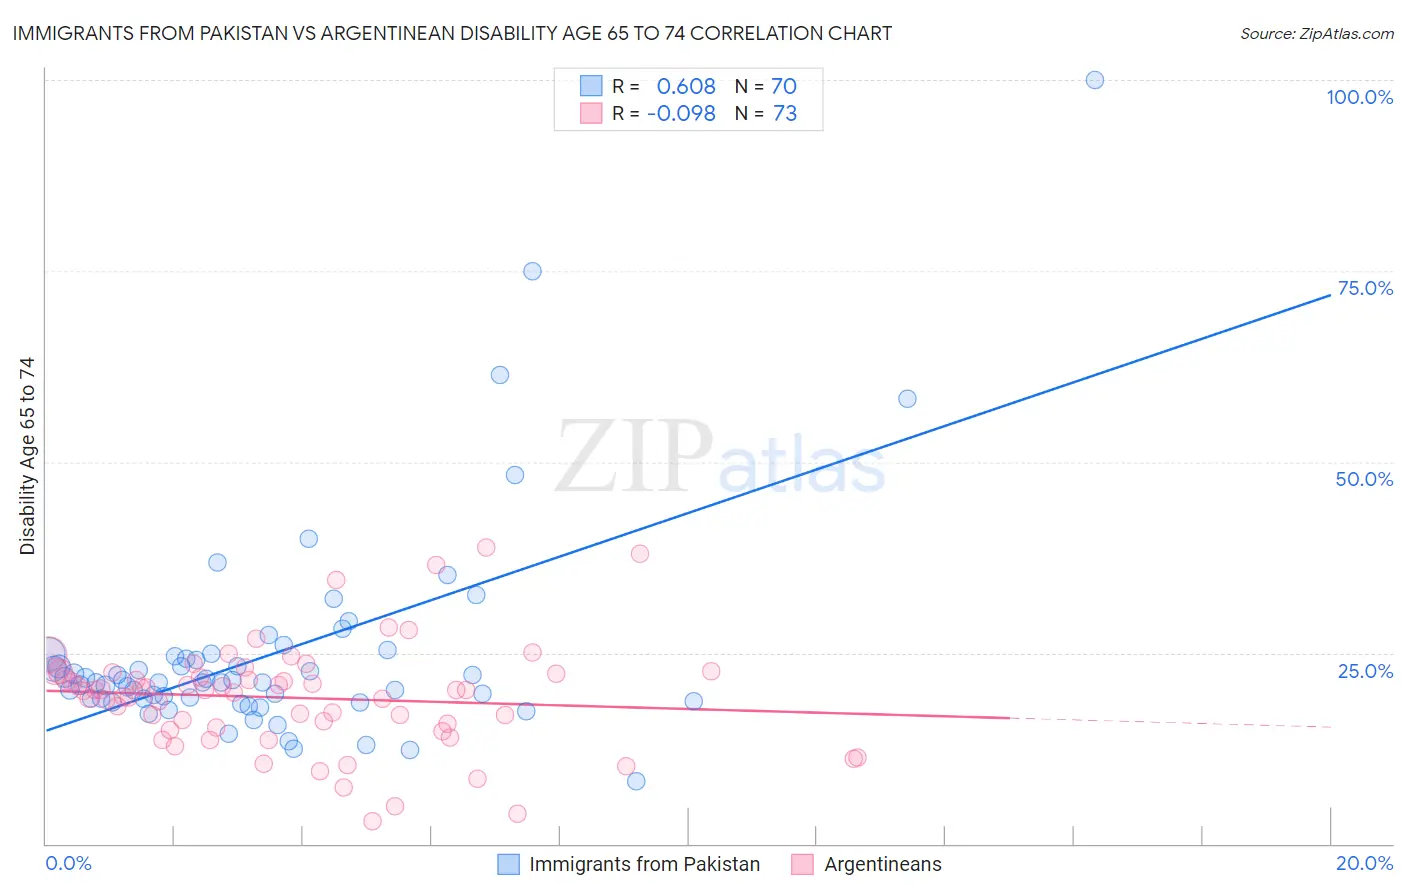
Immigrants from Pakistan vs Argentinean Disability Age 65 to 74 Correlation Chart
The statistical analysis conducted on geographies consisting of 283,535,607 people shows a significant positive correlation between the proportion of Immigrants from Pakistan and percentage of population with a disability between the ages 65 and 75 in the United States with a correlation coefficient (R) of 0.608 and weighted average of 21.5%. Similarly, the statistical analysis conducted on geographies consisting of 296,790,754 people shows a slight negative correlation between the proportion of Argentineans and percentage of population with a disability between the ages 65 and 75 in the United States with a correlation coefficient (R) of -0.098 and weighted average of 21.2%, a difference of 1.6%.
Disability Age 65 to 74 Correlation Summary
| Measurement | Immigrants from Pakistan | Argentinean |
| Minimum | 8.2% | 2.9% |
| Maximum | 100.0% | 38.9% |
| Range | 91.8% | 36.0% |
| Mean | 24.9% | 19.1% |
| Median | 21.1% | 20.1% |
| Interquartile 25% (IQ1) | 19.0% | 15.1% |
| Interquartile 75% (IQ3) | 24.6% | 22.4% |
| Interquartile Range (IQR) | 5.7% | 7.3% |
| Standard Deviation (Sample) | 14.2% | 6.9% |
| Standard Deviation (Population) | 14.1% | 6.9% |
Demographics Similar to Immigrants from Pakistan and Argentineans by Disability Age 65 to 74
In terms of disability age 65 to 74, the demographic groups most similar to Immigrants from Pakistan are Immigrants from Asia (21.5%, a difference of 0.030%), Immigrants from Denmark (21.5%, a difference of 0.13%), Immigrants from Romania (21.5%, a difference of 0.15%), Immigrants from Italy (21.5%, a difference of 0.23%), and Immigrants from France (21.5%, a difference of 0.24%). Similarly, the demographic groups most similar to Argentineans are Latvian (21.2%, a difference of 0.16%), Russian (21.2%, a difference of 0.18%), Immigrants from Austria (21.2%, a difference of 0.23%), Macedonian (21.3%, a difference of 0.66%), and Immigrants from Croatia (21.3%, a difference of 0.69%).
| Demographics | Rating | Rank | Disability Age 65 to 74 |
| Russians | 99.8 /100 | #38 | Exceptional 21.2% |
| Argentineans | 99.8 /100 | #39 | Exceptional 21.2% |
| Latvians | 99.8 /100 | #40 | Exceptional 21.2% |
| Immigrants | Austria | 99.8 /100 | #41 | Exceptional 21.2% |
| Macedonians | 99.7 /100 | #42 | Exceptional 21.3% |
| Immigrants | Croatia | 99.7 /100 | #43 | Exceptional 21.3% |
| Estonians | 99.7 /100 | #44 | Exceptional 21.4% |
| Asians | 99.7 /100 | #45 | Exceptional 21.4% |
| Immigrants | Turkey | 99.7 /100 | #46 | Exceptional 21.4% |
| Immigrants | Bulgaria | 99.7 /100 | #47 | Exceptional 21.4% |
| Lithuanians | 99.7 /100 | #48 | Exceptional 21.4% |
| Luxembourgers | 99.7 /100 | #49 | Exceptional 21.4% |
| Immigrants | Malaysia | 99.7 /100 | #50 | Exceptional 21.4% |
| Immigrants | Serbia | 99.6 /100 | #51 | Exceptional 21.4% |
| Immigrants | France | 99.6 /100 | #52 | Exceptional 21.5% |
| Bhutanese | 99.6 /100 | #53 | Exceptional 21.5% |
| Immigrants | Italy | 99.6 /100 | #54 | Exceptional 21.5% |
| Immigrants | Romania | 99.5 /100 | #55 | Exceptional 21.5% |
| Immigrants | Denmark | 99.5 /100 | #56 | Exceptional 21.5% |
| Immigrants | Asia | 99.5 /100 | #57 | Exceptional 21.5% |
| Immigrants | Pakistan | 99.5 /100 | #58 | Exceptional 21.5% |