Immigrants from Ireland vs Argentinean Cognitive Disability
COMPARE
Immigrants from Ireland
Argentinean
Cognitive Disability
Cognitive Disability Comparison
Immigrants from Ireland
Argentineans
16.1%
COGNITIVE DISABILITY
100.0/ 100
METRIC RATING
7th/ 347
METRIC RANK
16.6%
COGNITIVE DISABILITY
99.6/ 100
METRIC RATING
63rd/ 347
METRIC RANK
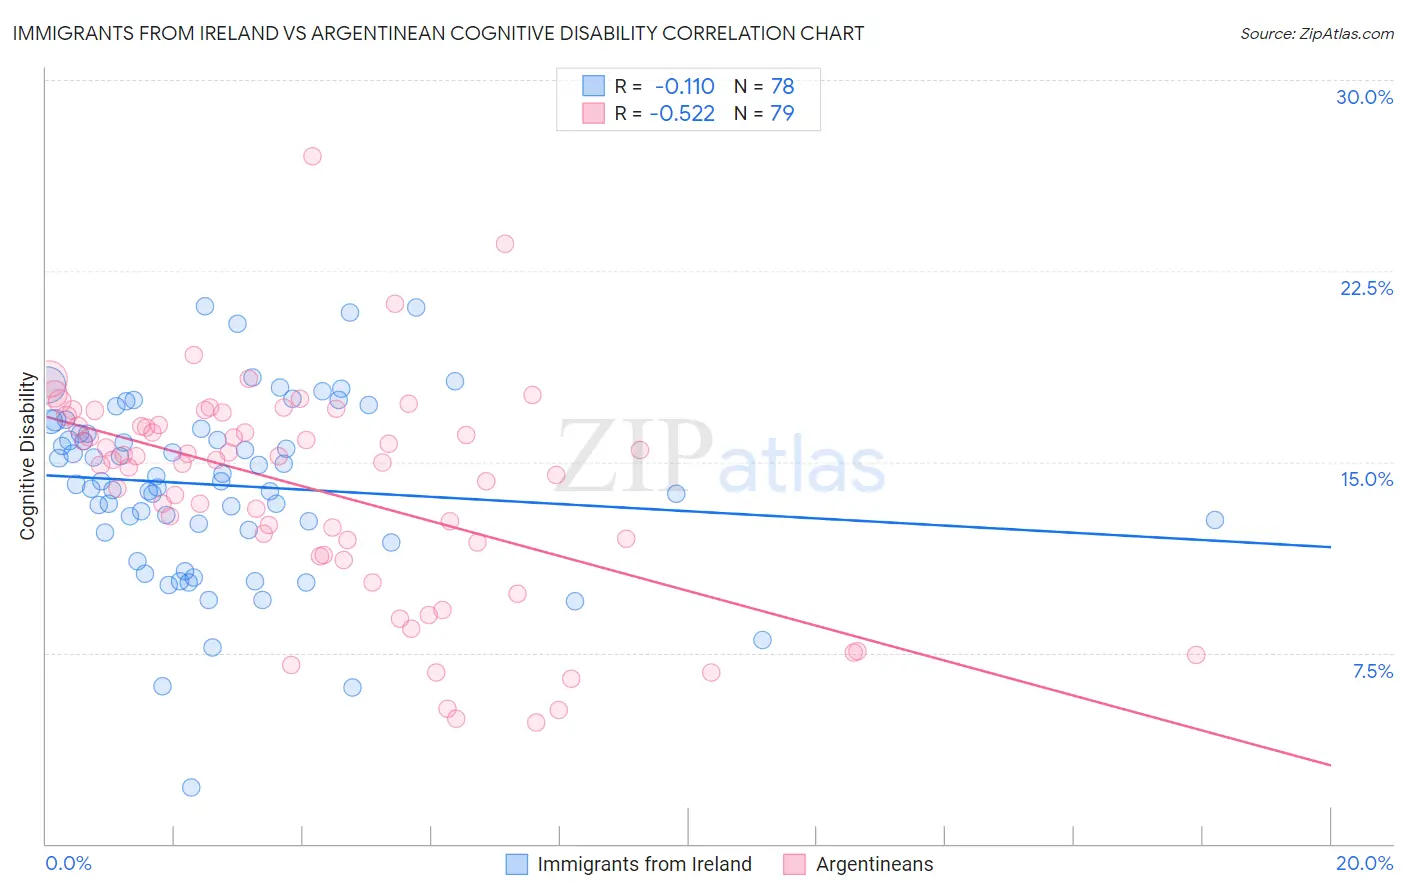
Immigrants from Ireland vs Argentinean Cognitive Disability Correlation Chart
The statistical analysis conducted on geographies consisting of 240,767,768 people shows a poor negative correlation between the proportion of Immigrants from Ireland and percentage of population with cognitive disability in the United States with a correlation coefficient (R) of -0.110 and weighted average of 16.1%. Similarly, the statistical analysis conducted on geographies consisting of 297,134,526 people shows a substantial negative correlation between the proportion of Argentineans and percentage of population with cognitive disability in the United States with a correlation coefficient (R) of -0.522 and weighted average of 16.6%, a difference of 2.9%.
Cognitive Disability Correlation Summary
| Measurement | Immigrants from Ireland | Argentinean |
| Minimum | 2.2% | 4.8% |
| Maximum | 21.1% | 27.0% |
| Range | 18.9% | 22.2% |
| Mean | 14.1% | 13.9% |
| Median | 14.2% | 15.1% |
| Interquartile 25% (IQ1) | 12.3% | 11.3% |
| Interquartile 75% (IQ3) | 16.3% | 16.5% |
| Interquartile Range (IQR) | 4.0% | 5.1% |
| Standard Deviation (Sample) | 3.5% | 4.3% |
| Standard Deviation (Population) | 3.5% | 4.2% |
Similar Demographics by Cognitive Disability
Demographics Similar to Immigrants from Ireland by Cognitive Disability
In terms of cognitive disability, the demographic groups most similar to Immigrants from Ireland are Immigrants from Poland (16.1%, a difference of 0.020%), Thai (16.1%, a difference of 0.11%), Assyrian/Chaldean/Syriac (16.2%, a difference of 0.34%), Immigrants from Scotland (16.2%, a difference of 0.38%), and Immigrants from Czechoslovakia (16.2%, a difference of 0.47%).
| Demographics | Rating | Rank | Cognitive Disability |
| Immigrants | Taiwan | 100.0 /100 | #1 | Exceptional 15.7% |
| Immigrants | India | 100.0 /100 | #2 | Exceptional 15.9% |
| Chinese | 100.0 /100 | #3 | Exceptional 15.9% |
| Immigrants | Lithuania | 100.0 /100 | #4 | Exceptional 16.0% |
| Immigrants | Hong Kong | 100.0 /100 | #5 | Exceptional 16.0% |
| Thais | 100.0 /100 | #6 | Exceptional 16.1% |
| Immigrants | Ireland | 100.0 /100 | #7 | Exceptional 16.1% |
| Immigrants | Poland | 100.0 /100 | #8 | Exceptional 16.1% |
| Assyrians/Chaldeans/Syriacs | 100.0 /100 | #9 | Exceptional 16.2% |
| Immigrants | Scotland | 100.0 /100 | #10 | Exceptional 16.2% |
| Immigrants | Czechoslovakia | 100.0 /100 | #11 | Exceptional 16.2% |
| Maltese | 100.0 /100 | #12 | Exceptional 16.2% |
| Lithuanians | 100.0 /100 | #13 | Exceptional 16.3% |
| Immigrants | Austria | 100.0 /100 | #14 | Exceptional 16.3% |
| Immigrants | Greece | 100.0 /100 | #15 | Exceptional 16.3% |
Demographics Similar to Argentineans by Cognitive Disability
In terms of cognitive disability, the demographic groups most similar to Argentineans are Czechoslovakian (16.6%, a difference of 0.020%), Immigrants from England (16.6%, a difference of 0.050%), Venezuelan (16.6%, a difference of 0.060%), Colombian (16.6%, a difference of 0.070%), and Romanian (16.6%, a difference of 0.12%).
| Demographics | Rating | Rank | Cognitive Disability |
| Austrians | 99.7 /100 | #56 | Exceptional 16.6% |
| Bhutanese | 99.7 /100 | #57 | Exceptional 16.6% |
| Pennsylvania Germans | 99.7 /100 | #58 | Exceptional 16.6% |
| Immigrants | Peru | 99.7 /100 | #59 | Exceptional 16.6% |
| Romanians | 99.7 /100 | #60 | Exceptional 16.6% |
| Immigrants | England | 99.6 /100 | #61 | Exceptional 16.6% |
| Czechoslovakians | 99.6 /100 | #62 | Exceptional 16.6% |
| Argentineans | 99.6 /100 | #63 | Exceptional 16.6% |
| Venezuelans | 99.6 /100 | #64 | Exceptional 16.6% |
| Colombians | 99.6 /100 | #65 | Exceptional 16.6% |
| Immigrants | Ukraine | 99.5 /100 | #66 | Exceptional 16.6% |
| Latvians | 99.5 /100 | #67 | Exceptional 16.6% |
| Ukrainians | 99.4 /100 | #68 | Exceptional 16.6% |
| Immigrants | Uzbekistan | 99.4 /100 | #69 | Exceptional 16.7% |
| Immigrants | Sweden | 99.4 /100 | #70 | Exceptional 16.7% |