Immigrants from Liberia vs Argentinean Cognitive Disability
COMPARE
Immigrants from Liberia
Argentinean
Cognitive Disability
Cognitive Disability Comparison
Immigrants from Liberia
Argentineans
18.7%
COGNITIVE DISABILITY
0.0/ 100
METRIC RATING
322nd/ 347
METRIC RANK
16.6%
COGNITIVE DISABILITY
99.6/ 100
METRIC RATING
63rd/ 347
METRIC RANK
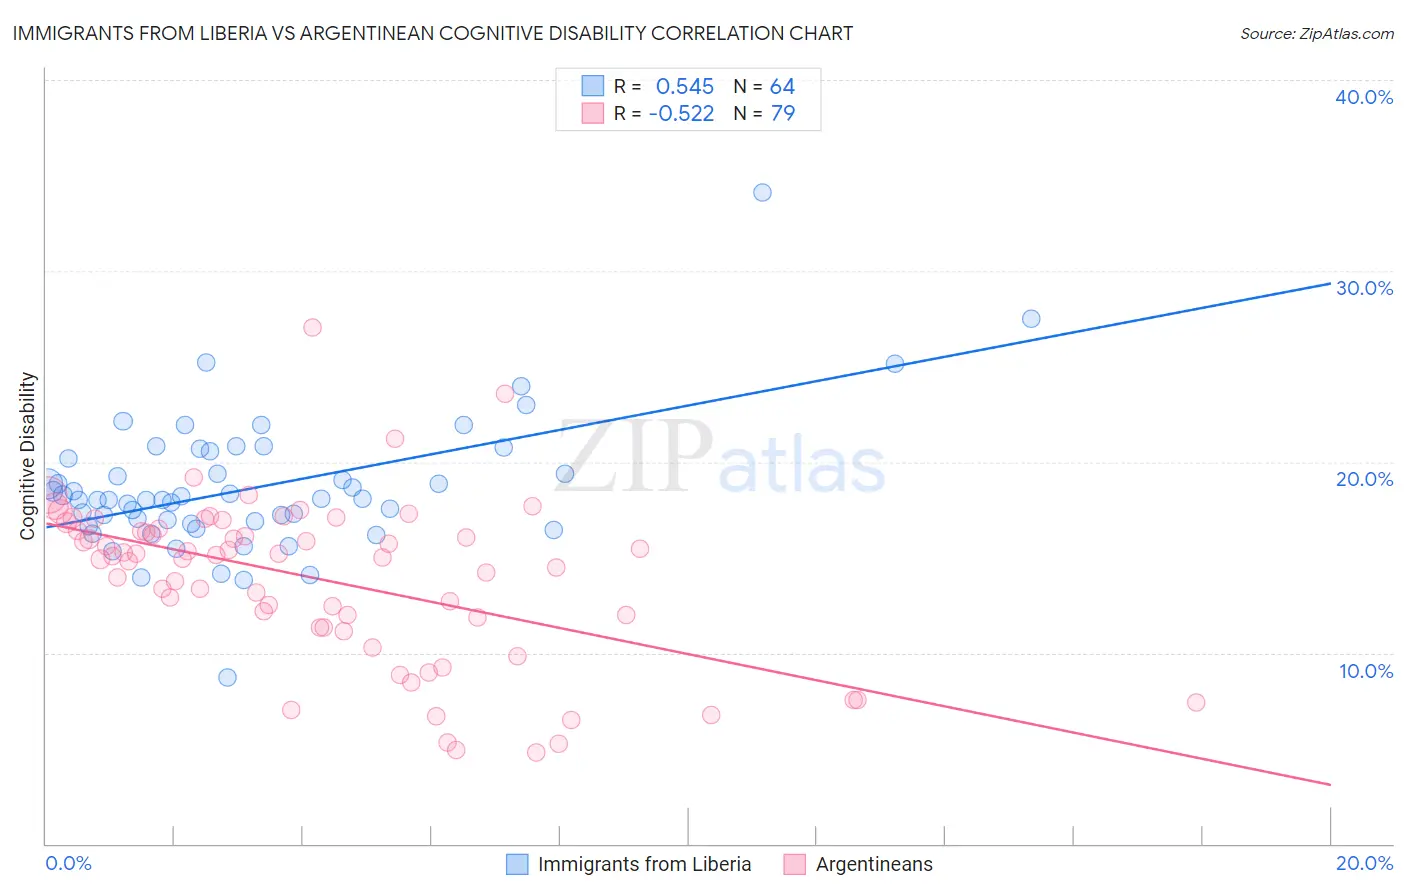
Immigrants from Liberia vs Argentinean Cognitive Disability Correlation Chart
The statistical analysis conducted on geographies consisting of 135,261,320 people shows a substantial positive correlation between the proportion of Immigrants from Liberia and percentage of population with cognitive disability in the United States with a correlation coefficient (R) of 0.545 and weighted average of 18.7%. Similarly, the statistical analysis conducted on geographies consisting of 297,134,526 people shows a substantial negative correlation between the proportion of Argentineans and percentage of population with cognitive disability in the United States with a correlation coefficient (R) of -0.522 and weighted average of 16.6%, a difference of 12.4%.
Cognitive Disability Correlation Summary
| Measurement | Immigrants from Liberia | Argentinean |
| Minimum | 8.7% | 4.8% |
| Maximum | 34.1% | 27.0% |
| Range | 25.4% | 22.2% |
| Mean | 18.7% | 13.9% |
| Median | 18.0% | 15.1% |
| Interquartile 25% (IQ1) | 16.8% | 11.3% |
| Interquartile 75% (IQ3) | 20.4% | 16.5% |
| Interquartile Range (IQR) | 3.6% | 5.1% |
| Standard Deviation (Sample) | 3.6% | 4.3% |
| Standard Deviation (Population) | 3.6% | 4.2% |
Similar Demographics by Cognitive Disability
Demographics Similar to Immigrants from Liberia by Cognitive Disability
In terms of cognitive disability, the demographic groups most similar to Immigrants from Liberia are Pueblo (18.7%, a difference of 0.020%), African (18.6%, a difference of 0.060%), Dominican (18.7%, a difference of 0.14%), Apache (18.6%, a difference of 0.16%), and Comanche (18.6%, a difference of 0.19%).
| Demographics | Rating | Rank | Cognitive Disability |
| Immigrants | Dominica | 0.0 /100 | #315 | Tragic 18.6% |
| Immigrants | Middle Africa | 0.0 /100 | #316 | Tragic 18.6% |
| Liberians | 0.0 /100 | #317 | Tragic 18.6% |
| Bangladeshis | 0.0 /100 | #318 | Tragic 18.6% |
| Comanche | 0.0 /100 | #319 | Tragic 18.6% |
| Apache | 0.0 /100 | #320 | Tragic 18.6% |
| Africans | 0.0 /100 | #321 | Tragic 18.6% |
| Immigrants | Liberia | 0.0 /100 | #322 | Tragic 18.7% |
| Pueblo | 0.0 /100 | #323 | Tragic 18.7% |
| Dominicans | 0.0 /100 | #324 | Tragic 18.7% |
| Indonesians | 0.0 /100 | #325 | Tragic 18.7% |
| Immigrants | Senegal | 0.0 /100 | #326 | Tragic 18.7% |
| U.S. Virgin Islanders | 0.0 /100 | #327 | Tragic 18.7% |
| Kiowa | 0.0 /100 | #328 | Tragic 18.7% |
| Navajo | 0.0 /100 | #329 | Tragic 18.8% |
Demographics Similar to Argentineans by Cognitive Disability
In terms of cognitive disability, the demographic groups most similar to Argentineans are Czechoslovakian (16.6%, a difference of 0.020%), Immigrants from England (16.6%, a difference of 0.050%), Venezuelan (16.6%, a difference of 0.060%), Colombian (16.6%, a difference of 0.070%), and Romanian (16.6%, a difference of 0.12%).
| Demographics | Rating | Rank | Cognitive Disability |
| Austrians | 99.7 /100 | #56 | Exceptional 16.6% |
| Bhutanese | 99.7 /100 | #57 | Exceptional 16.6% |
| Pennsylvania Germans | 99.7 /100 | #58 | Exceptional 16.6% |
| Immigrants | Peru | 99.7 /100 | #59 | Exceptional 16.6% |
| Romanians | 99.7 /100 | #60 | Exceptional 16.6% |
| Immigrants | England | 99.6 /100 | #61 | Exceptional 16.6% |
| Czechoslovakians | 99.6 /100 | #62 | Exceptional 16.6% |
| Argentineans | 99.6 /100 | #63 | Exceptional 16.6% |
| Venezuelans | 99.6 /100 | #64 | Exceptional 16.6% |
| Colombians | 99.6 /100 | #65 | Exceptional 16.6% |
| Immigrants | Ukraine | 99.5 /100 | #66 | Exceptional 16.6% |
| Latvians | 99.5 /100 | #67 | Exceptional 16.6% |
| Ukrainians | 99.4 /100 | #68 | Exceptional 16.6% |
| Immigrants | Uzbekistan | 99.4 /100 | #69 | Exceptional 16.7% |
| Immigrants | Sweden | 99.4 /100 | #70 | Exceptional 16.7% |