Hungarian vs Argentinean Cognitive Disability
COMPARE
Hungarian
Argentinean
Cognitive Disability
Cognitive Disability Comparison
Hungarians
Argentineans
16.5%
COGNITIVE DISABILITY
99.9/ 100
METRIC RATING
42nd/ 347
METRIC RANK
16.6%
COGNITIVE DISABILITY
99.6/ 100
METRIC RATING
63rd/ 347
METRIC RANK
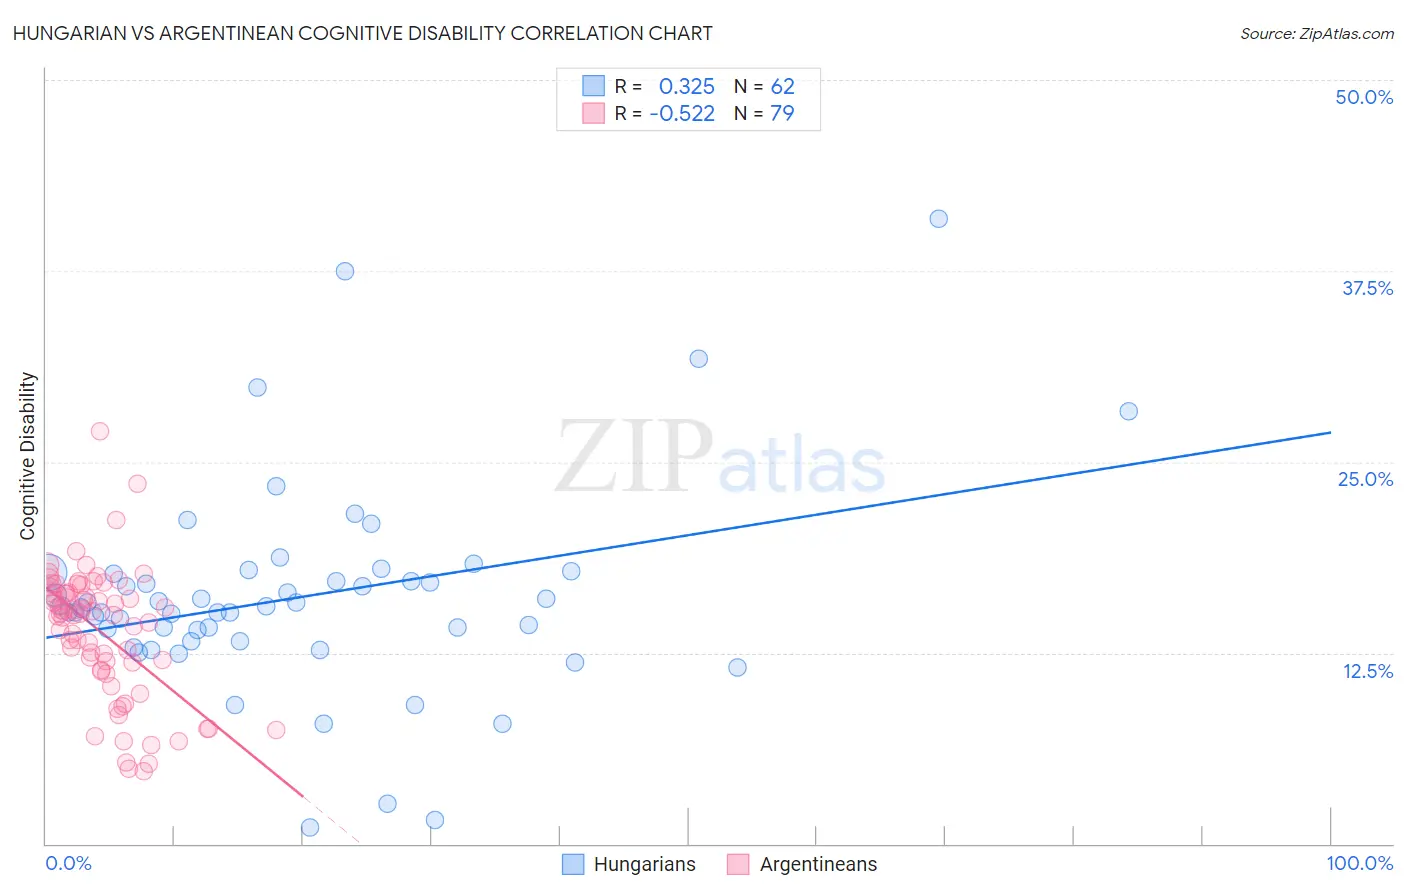
Hungarian vs Argentinean Cognitive Disability Correlation Chart
The statistical analysis conducted on geographies consisting of 486,167,723 people shows a mild positive correlation between the proportion of Hungarians and percentage of population with cognitive disability in the United States with a correlation coefficient (R) of 0.325 and weighted average of 16.5%. Similarly, the statistical analysis conducted on geographies consisting of 297,134,526 people shows a substantial negative correlation between the proportion of Argentineans and percentage of population with cognitive disability in the United States with a correlation coefficient (R) of -0.522 and weighted average of 16.6%, a difference of 0.77%.
Cognitive Disability Correlation Summary
| Measurement | Hungarian | Argentinean |
| Minimum | 1.0% | 4.8% |
| Maximum | 40.9% | 27.0% |
| Range | 39.9% | 22.2% |
| Mean | 16.1% | 13.9% |
| Median | 15.5% | 15.1% |
| Interquartile 25% (IQ1) | 13.3% | 11.3% |
| Interquartile 75% (IQ3) | 17.7% | 16.5% |
| Interquartile Range (IQR) | 4.4% | 5.1% |
| Standard Deviation (Sample) | 6.8% | 4.3% |
| Standard Deviation (Population) | 6.7% | 4.2% |
Similar Demographics by Cognitive Disability
Demographics Similar to Hungarians by Cognitive Disability
In terms of cognitive disability, the demographic groups most similar to Hungarians are Cuban (16.5%, a difference of 0.010%), Immigrants from Belarus (16.5%, a difference of 0.020%), Bolivian (16.5%, a difference of 0.030%), Immigrants from Canada (16.5%, a difference of 0.060%), and Macedonian (16.5%, a difference of 0.090%).
| Demographics | Rating | Rank | Cognitive Disability |
| Slovaks | 99.9 /100 | #35 | Exceptional 16.4% |
| Greeks | 99.9 /100 | #36 | Exceptional 16.4% |
| Slovenes | 99.9 /100 | #37 | Exceptional 16.5% |
| Immigrants | Eastern Europe | 99.9 /100 | #38 | Exceptional 16.5% |
| Bolivians | 99.9 /100 | #39 | Exceptional 16.5% |
| Immigrants | Belarus | 99.9 /100 | #40 | Exceptional 16.5% |
| Cubans | 99.9 /100 | #41 | Exceptional 16.5% |
| Hungarians | 99.9 /100 | #42 | Exceptional 16.5% |
| Immigrants | Canada | 99.8 /100 | #43 | Exceptional 16.5% |
| Macedonians | 99.8 /100 | #44 | Exceptional 16.5% |
| Immigrants | Europe | 99.8 /100 | #45 | Exceptional 16.5% |
| Immigrants | Colombia | 99.8 /100 | #46 | Exceptional 16.5% |
| Immigrants | Italy | 99.8 /100 | #47 | Exceptional 16.5% |
| Immigrants | North America | 99.8 /100 | #48 | Exceptional 16.5% |
| Iranians | 99.8 /100 | #49 | Exceptional 16.5% |
Demographics Similar to Argentineans by Cognitive Disability
In terms of cognitive disability, the demographic groups most similar to Argentineans are Czechoslovakian (16.6%, a difference of 0.020%), Immigrants from England (16.6%, a difference of 0.050%), Venezuelan (16.6%, a difference of 0.060%), Colombian (16.6%, a difference of 0.070%), and Romanian (16.6%, a difference of 0.12%).
| Demographics | Rating | Rank | Cognitive Disability |
| Austrians | 99.7 /100 | #56 | Exceptional 16.6% |
| Bhutanese | 99.7 /100 | #57 | Exceptional 16.6% |
| Pennsylvania Germans | 99.7 /100 | #58 | Exceptional 16.6% |
| Immigrants | Peru | 99.7 /100 | #59 | Exceptional 16.6% |
| Romanians | 99.7 /100 | #60 | Exceptional 16.6% |
| Immigrants | England | 99.6 /100 | #61 | Exceptional 16.6% |
| Czechoslovakians | 99.6 /100 | #62 | Exceptional 16.6% |
| Argentineans | 99.6 /100 | #63 | Exceptional 16.6% |
| Venezuelans | 99.6 /100 | #64 | Exceptional 16.6% |
| Colombians | 99.6 /100 | #65 | Exceptional 16.6% |
| Immigrants | Ukraine | 99.5 /100 | #66 | Exceptional 16.6% |
| Latvians | 99.5 /100 | #67 | Exceptional 16.6% |
| Ukrainians | 99.4 /100 | #68 | Exceptional 16.6% |
| Immigrants | Uzbekistan | 99.4 /100 | #69 | Exceptional 16.7% |
| Immigrants | Sweden | 99.4 /100 | #70 | Exceptional 16.7% |