Marshallese vs Argentinean Cognitive Disability
COMPARE
Marshallese
Argentinean
Cognitive Disability
Cognitive Disability Comparison
Marshallese
Argentineans
17.7%
COGNITIVE DISABILITY
2.7/ 100
METRIC RATING
226th/ 347
METRIC RANK
16.6%
COGNITIVE DISABILITY
99.6/ 100
METRIC RATING
63rd/ 347
METRIC RANK
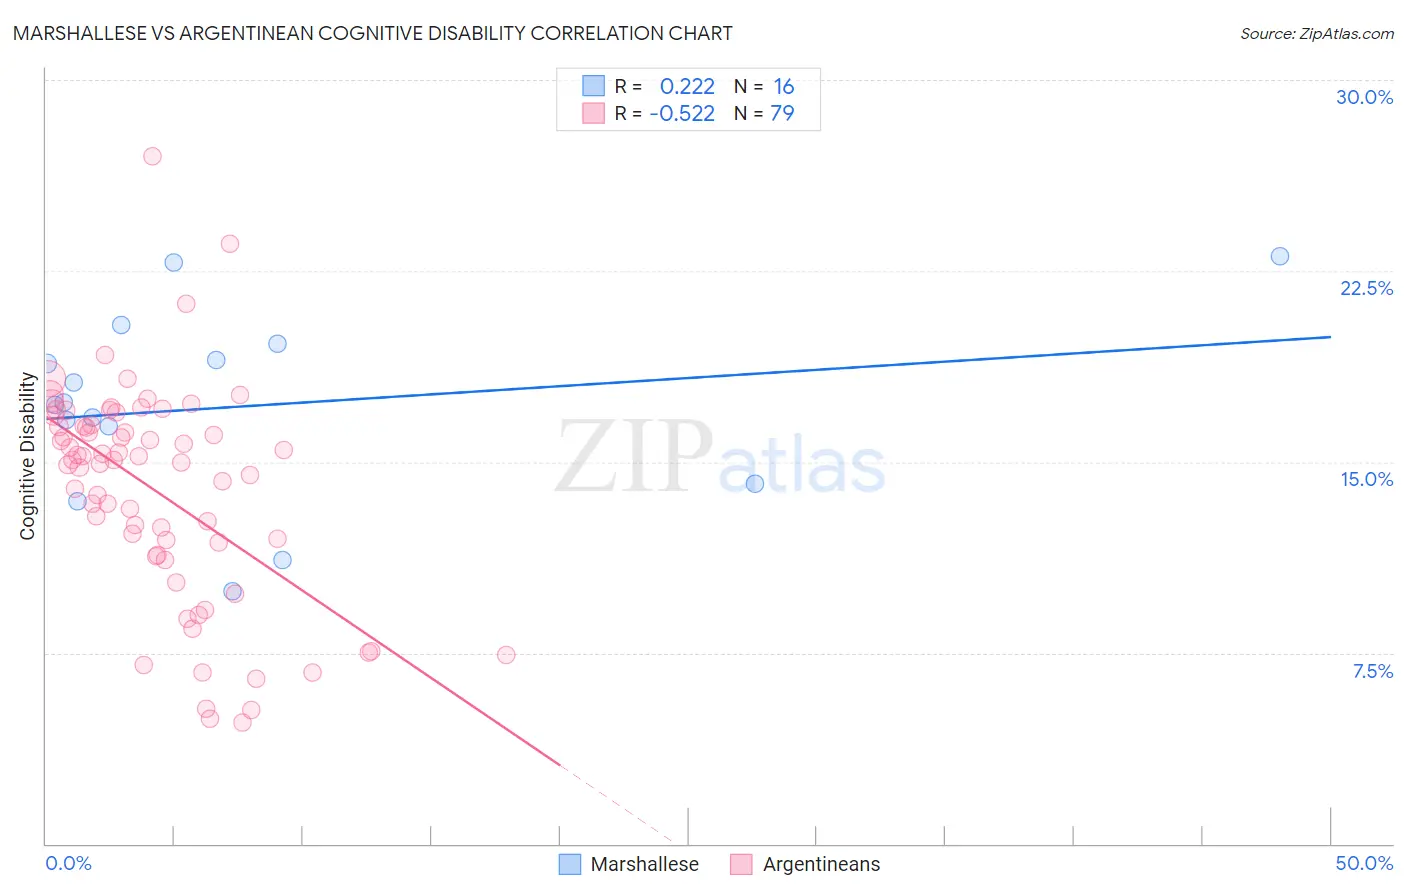
Marshallese vs Argentinean Cognitive Disability Correlation Chart
The statistical analysis conducted on geographies consisting of 14,761,315 people shows a weak positive correlation between the proportion of Marshallese and percentage of population with cognitive disability in the United States with a correlation coefficient (R) of 0.222 and weighted average of 17.7%. Similarly, the statistical analysis conducted on geographies consisting of 297,134,526 people shows a substantial negative correlation between the proportion of Argentineans and percentage of population with cognitive disability in the United States with a correlation coefficient (R) of -0.522 and weighted average of 16.6%, a difference of 6.7%.
Cognitive Disability Correlation Summary
| Measurement | Marshallese | Argentinean |
| Minimum | 9.9% | 4.8% |
| Maximum | 23.1% | 27.0% |
| Range | 13.1% | 22.2% |
| Mean | 17.2% | 13.9% |
| Median | 17.3% | 15.1% |
| Interquartile 25% (IQ1) | 15.3% | 11.3% |
| Interquartile 75% (IQ3) | 19.3% | 16.5% |
| Interquartile Range (IQR) | 4.0% | 5.1% |
| Standard Deviation (Sample) | 3.7% | 4.3% |
| Standard Deviation (Population) | 3.6% | 4.2% |
Similar Demographics by Cognitive Disability
Demographics Similar to Marshallese by Cognitive Disability
In terms of cognitive disability, the demographic groups most similar to Marshallese are Immigrants from St. Vincent and the Grenadines (17.7%, a difference of 0.030%), Immigrants from Central America (17.7%, a difference of 0.11%), Immigrants from Guatemala (17.7%, a difference of 0.13%), Vietnamese (17.7%, a difference of 0.16%), and Mongolian (17.7%, a difference of 0.16%).
| Demographics | Rating | Rank | Cognitive Disability |
| Immigrants | Sierra Leone | 6.3 /100 | #219 | Tragic 17.6% |
| Zimbabweans | 6.1 /100 | #220 | Tragic 17.6% |
| Moroccans | 5.9 /100 | #221 | Tragic 17.6% |
| Central Americans | 4.5 /100 | #222 | Tragic 17.7% |
| Alsatians | 4.5 /100 | #223 | Tragic 17.7% |
| Fijians | 3.4 /100 | #224 | Tragic 17.7% |
| Vietnamese | 3.4 /100 | #225 | Tragic 17.7% |
| Marshallese | 2.7 /100 | #226 | Tragic 17.7% |
| Immigrants | St. Vincent and the Grenadines | 2.6 /100 | #227 | Tragic 17.7% |
| Immigrants | Central America | 2.3 /100 | #228 | Tragic 17.7% |
| Immigrants | Guatemala | 2.2 /100 | #229 | Tragic 17.7% |
| Mongolians | 2.2 /100 | #230 | Tragic 17.7% |
| Guatemalans | 2.1 /100 | #231 | Tragic 17.8% |
| Tongans | 2.1 /100 | #232 | Tragic 17.8% |
| Panamanians | 2.1 /100 | #233 | Tragic 17.8% |
Demographics Similar to Argentineans by Cognitive Disability
In terms of cognitive disability, the demographic groups most similar to Argentineans are Czechoslovakian (16.6%, a difference of 0.020%), Immigrants from England (16.6%, a difference of 0.050%), Venezuelan (16.6%, a difference of 0.060%), Colombian (16.6%, a difference of 0.070%), and Romanian (16.6%, a difference of 0.12%).
| Demographics | Rating | Rank | Cognitive Disability |
| Austrians | 99.7 /100 | #56 | Exceptional 16.6% |
| Bhutanese | 99.7 /100 | #57 | Exceptional 16.6% |
| Pennsylvania Germans | 99.7 /100 | #58 | Exceptional 16.6% |
| Immigrants | Peru | 99.7 /100 | #59 | Exceptional 16.6% |
| Romanians | 99.7 /100 | #60 | Exceptional 16.6% |
| Immigrants | England | 99.6 /100 | #61 | Exceptional 16.6% |
| Czechoslovakians | 99.6 /100 | #62 | Exceptional 16.6% |
| Argentineans | 99.6 /100 | #63 | Exceptional 16.6% |
| Venezuelans | 99.6 /100 | #64 | Exceptional 16.6% |
| Colombians | 99.6 /100 | #65 | Exceptional 16.6% |
| Immigrants | Ukraine | 99.5 /100 | #66 | Exceptional 16.6% |
| Latvians | 99.5 /100 | #67 | Exceptional 16.6% |
| Ukrainians | 99.4 /100 | #68 | Exceptional 16.6% |
| Immigrants | Uzbekistan | 99.4 /100 | #69 | Exceptional 16.7% |
| Immigrants | Sweden | 99.4 /100 | #70 | Exceptional 16.7% |