Scandinavian vs Soviet Union Male Disability
COMPARE
Scandinavian
Soviet Union
Male Disability
Male Disability Comparison
Scandinavians
Soviet Union
12.3%
MALE DISABILITY
0.1/ 100
METRIC RATING
271st/ 347
METRIC RANK
10.1%
MALE DISABILITY
99.9/ 100
METRIC RATING
31st/ 347
METRIC RANK
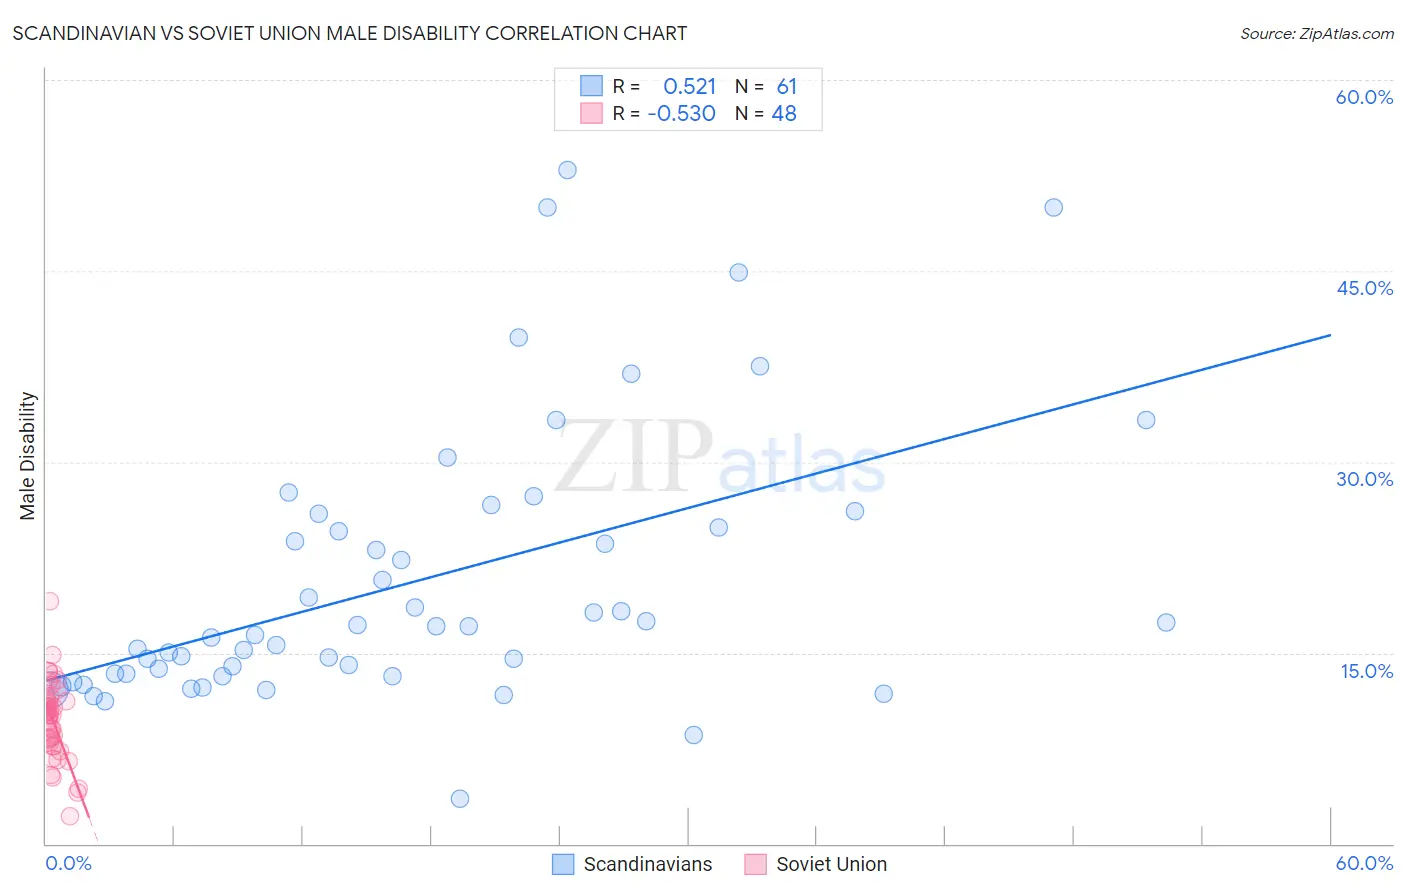
Scandinavian vs Soviet Union Male Disability Correlation Chart
The statistical analysis conducted on geographies consisting of 472,512,703 people shows a substantial positive correlation between the proportion of Scandinavians and percentage of males with a disability in the United States with a correlation coefficient (R) of 0.521 and weighted average of 12.3%. Similarly, the statistical analysis conducted on geographies consisting of 43,487,843 people shows a substantial negative correlation between the proportion of Soviet Union and percentage of males with a disability in the United States with a correlation coefficient (R) of -0.530 and weighted average of 10.1%, a difference of 21.7%.
Male Disability Correlation Summary
| Measurement | Scandinavian | Soviet Union |
| Minimum | 3.5% | 2.2% |
| Maximum | 52.9% | 19.1% |
| Range | 49.4% | 16.9% |
| Mean | 20.6% | 9.8% |
| Median | 17.0% | 10.2% |
| Interquartile 25% (IQ1) | 13.3% | 8.0% |
| Interquartile 75% (IQ3) | 25.4% | 11.2% |
| Interquartile Range (IQR) | 12.1% | 3.2% |
| Standard Deviation (Sample) | 10.7% | 3.0% |
| Standard Deviation (Population) | 10.7% | 3.0% |
Similar Demographics by Male Disability
Demographics Similar to Scandinavians by Male Disability
In terms of male disability, the demographic groups most similar to Scandinavians are Spaniard (12.3%, a difference of 0.19%), Portuguese (12.3%, a difference of 0.27%), Czechoslovakian (12.3%, a difference of 0.27%), Immigrants from Germany (12.3%, a difference of 0.40%), and Hawaiian (12.3%, a difference of 0.45%).
| Demographics | Rating | Rank | Male Disability |
| Nepalese | 0.2 /100 | #264 | Tragic 12.2% |
| Immigrants | Portugal | 0.1 /100 | #265 | Tragic 12.3% |
| Hawaiians | 0.1 /100 | #266 | Tragic 12.3% |
| Immigrants | Germany | 0.1 /100 | #267 | Tragic 12.3% |
| Portuguese | 0.1 /100 | #268 | Tragic 12.3% |
| Czechoslovakians | 0.1 /100 | #269 | Tragic 12.3% |
| Spaniards | 0.1 /100 | #270 | Tragic 12.3% |
| Scandinavians | 0.1 /100 | #271 | Tragic 12.3% |
| Hmong | 0.0 /100 | #272 | Tragic 12.5% |
| Native Hawaiians | 0.0 /100 | #273 | Tragic 12.5% |
| Hopi | 0.0 /100 | #274 | Tragic 12.5% |
| Fijians | 0.0 /100 | #275 | Tragic 12.6% |
| Africans | 0.0 /100 | #276 | Tragic 12.6% |
| Finns | 0.0 /100 | #277 | Tragic 12.6% |
| Central American Indians | 0.0 /100 | #278 | Tragic 12.7% |
Demographics Similar to Soviet Union by Male Disability
In terms of male disability, the demographic groups most similar to Soviet Union are Immigrants from Egypt (10.1%, a difference of 0.070%), Venezuelan (10.1%, a difference of 0.10%), Argentinean (10.1%, a difference of 0.15%), Vietnamese (10.1%, a difference of 0.26%), and Egyptian (10.1%, a difference of 0.28%).
| Demographics | Rating | Rank | Male Disability |
| Immigrants | Asia | 100.0 /100 | #24 | Exceptional 10.0% |
| Immigrants | Malaysia | 99.9 /100 | #25 | Exceptional 10.0% |
| Paraguayans | 99.9 /100 | #26 | Exceptional 10.1% |
| Egyptians | 99.9 /100 | #27 | Exceptional 10.1% |
| Vietnamese | 99.9 /100 | #28 | Exceptional 10.1% |
| Venezuelans | 99.9 /100 | #29 | Exceptional 10.1% |
| Immigrants | Egypt | 99.9 /100 | #30 | Exceptional 10.1% |
| Soviet Union | 99.9 /100 | #31 | Exceptional 10.1% |
| Argentineans | 99.9 /100 | #32 | Exceptional 10.1% |
| Immigrants | Ethiopia | 99.9 /100 | #33 | Exceptional 10.2% |
| Immigrants | Turkey | 99.9 /100 | #34 | Exceptional 10.2% |
| Immigrants | Argentina | 99.9 /100 | #35 | Exceptional 10.2% |
| Ethiopians | 99.8 /100 | #36 | Exceptional 10.2% |
| Immigrants | Indonesia | 99.8 /100 | #37 | Exceptional 10.2% |
| Immigrants | Kuwait | 99.8 /100 | #38 | Exceptional 10.2% |