Liberian vs Soviet Union Male Disability
COMPARE
Liberian
Soviet Union
Male Disability
Male Disability Comparison
Liberians
Soviet Union
11.8%
MALE DISABILITY
3.1/ 100
METRIC RATING
225th/ 347
METRIC RANK
10.1%
MALE DISABILITY
99.9/ 100
METRIC RATING
31st/ 347
METRIC RANK
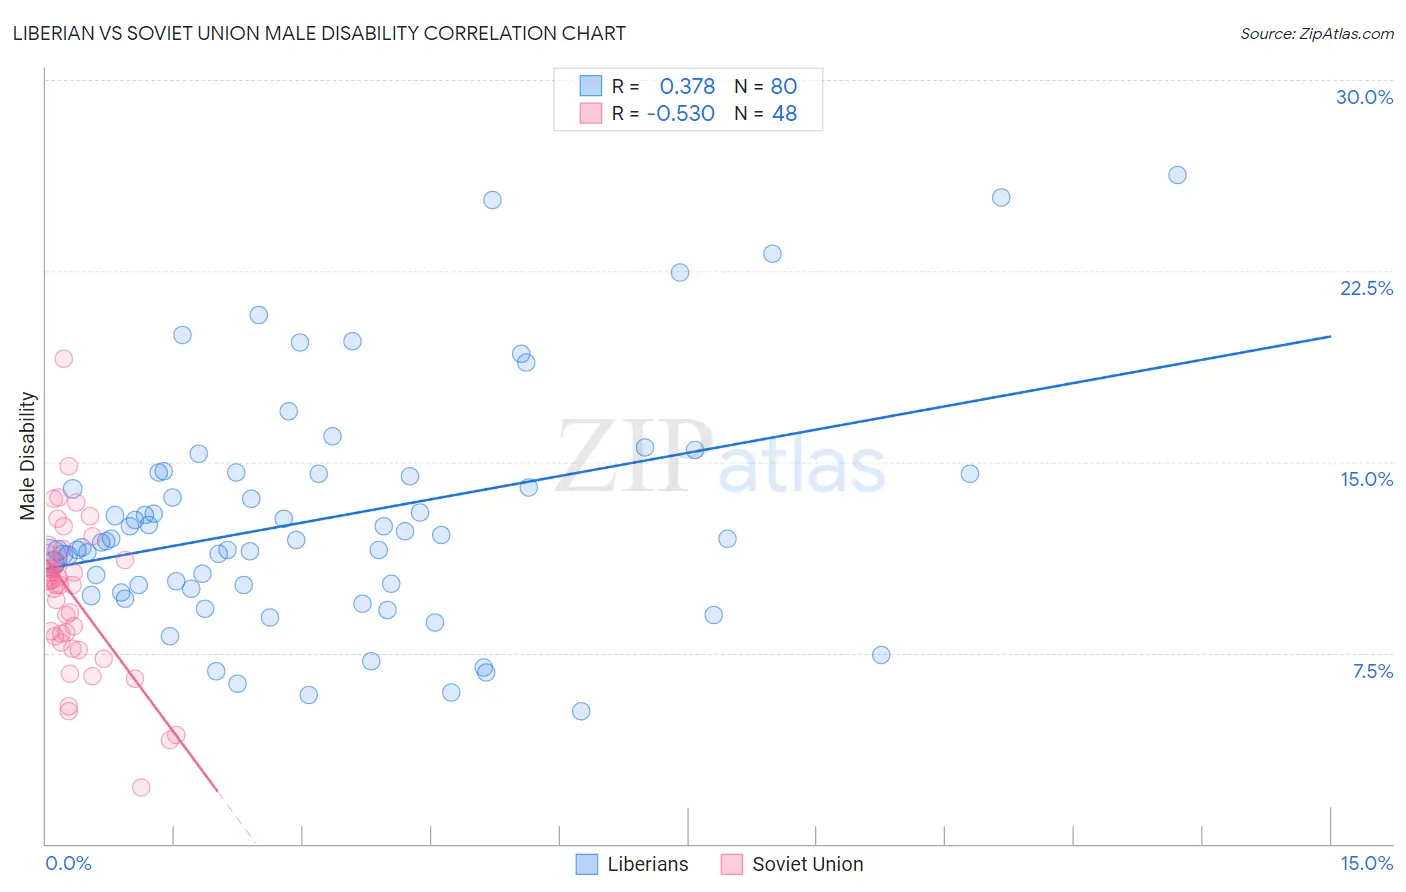
Liberian vs Soviet Union Male Disability Correlation Chart
The statistical analysis conducted on geographies consisting of 118,082,647 people shows a mild positive correlation between the proportion of Liberians and percentage of males with a disability in the United States with a correlation coefficient (R) of 0.378 and weighted average of 11.8%. Similarly, the statistical analysis conducted on geographies consisting of 43,487,843 people shows a substantial negative correlation between the proportion of Soviet Union and percentage of males with a disability in the United States with a correlation coefficient (R) of -0.530 and weighted average of 10.1%, a difference of 16.1%.
Male Disability Correlation Summary
| Measurement | Liberian | Soviet Union |
| Minimum | 5.2% | 2.2% |
| Maximum | 26.3% | 19.1% |
| Range | 21.1% | 16.9% |
| Mean | 12.8% | 9.8% |
| Median | 11.9% | 10.2% |
| Interquartile 25% (IQ1) | 10.1% | 8.0% |
| Interquartile 75% (IQ3) | 14.5% | 11.2% |
| Interquartile Range (IQR) | 4.5% | 3.2% |
| Standard Deviation (Sample) | 4.5% | 3.0% |
| Standard Deviation (Population) | 4.5% | 3.0% |
Similar Demographics by Male Disability
Demographics Similar to Liberians by Male Disability
In terms of male disability, the demographic groups most similar to Liberians are Japanese (11.7%, a difference of 0.010%), Immigrants from Bahamas (11.7%, a difference of 0.030%), Alsatian (11.7%, a difference of 0.12%), Subsaharan African (11.8%, a difference of 0.12%), and Immigrants from Congo (11.7%, a difference of 0.27%).
| Demographics | Rating | Rank | Male Disability |
| Immigrants | England | 4.0 /100 | #218 | Tragic 11.7% |
| Panamanians | 3.8 /100 | #219 | Tragic 11.7% |
| Immigrants | Western Europe | 3.8 /100 | #220 | Tragic 11.7% |
| Immigrants | Congo | 3.7 /100 | #221 | Tragic 11.7% |
| Alsatians | 3.3 /100 | #222 | Tragic 11.7% |
| Immigrants | Bahamas | 3.2 /100 | #223 | Tragic 11.7% |
| Japanese | 3.1 /100 | #224 | Tragic 11.7% |
| Liberians | 3.1 /100 | #225 | Tragic 11.8% |
| Sub-Saharan Africans | 2.8 /100 | #226 | Tragic 11.8% |
| Austrians | 2.5 /100 | #227 | Tragic 11.8% |
| Hispanics or Latinos | 2.3 /100 | #228 | Tragic 11.8% |
| Bermudans | 2.3 /100 | #229 | Tragic 11.8% |
| Croatians | 2.1 /100 | #230 | Tragic 11.8% |
| Dominicans | 1.8 /100 | #231 | Tragic 11.8% |
| Malaysians | 1.8 /100 | #232 | Tragic 11.8% |
Demographics Similar to Soviet Union by Male Disability
In terms of male disability, the demographic groups most similar to Soviet Union are Immigrants from Egypt (10.1%, a difference of 0.070%), Venezuelan (10.1%, a difference of 0.10%), Argentinean (10.1%, a difference of 0.15%), Vietnamese (10.1%, a difference of 0.26%), and Egyptian (10.1%, a difference of 0.28%).
| Demographics | Rating | Rank | Male Disability |
| Immigrants | Asia | 100.0 /100 | #24 | Exceptional 10.0% |
| Immigrants | Malaysia | 99.9 /100 | #25 | Exceptional 10.0% |
| Paraguayans | 99.9 /100 | #26 | Exceptional 10.1% |
| Egyptians | 99.9 /100 | #27 | Exceptional 10.1% |
| Vietnamese | 99.9 /100 | #28 | Exceptional 10.1% |
| Venezuelans | 99.9 /100 | #29 | Exceptional 10.1% |
| Immigrants | Egypt | 99.9 /100 | #30 | Exceptional 10.1% |
| Soviet Union | 99.9 /100 | #31 | Exceptional 10.1% |
| Argentineans | 99.9 /100 | #32 | Exceptional 10.1% |
| Immigrants | Ethiopia | 99.9 /100 | #33 | Exceptional 10.2% |
| Immigrants | Turkey | 99.9 /100 | #34 | Exceptional 10.2% |
| Immigrants | Argentina | 99.9 /100 | #35 | Exceptional 10.2% |
| Ethiopians | 99.8 /100 | #36 | Exceptional 10.2% |
| Immigrants | Indonesia | 99.8 /100 | #37 | Exceptional 10.2% |
| Immigrants | Kuwait | 99.8 /100 | #38 | Exceptional 10.2% |