Indonesian vs Soviet Union Male Disability
COMPARE
Indonesian
Soviet Union
Male Disability
Male Disability Comparison
Indonesians
Soviet Union
11.6%
MALE DISABILITY
5.9/ 100
METRIC RATING
215th/ 347
METRIC RANK
10.1%
MALE DISABILITY
99.9/ 100
METRIC RATING
31st/ 347
METRIC RANK
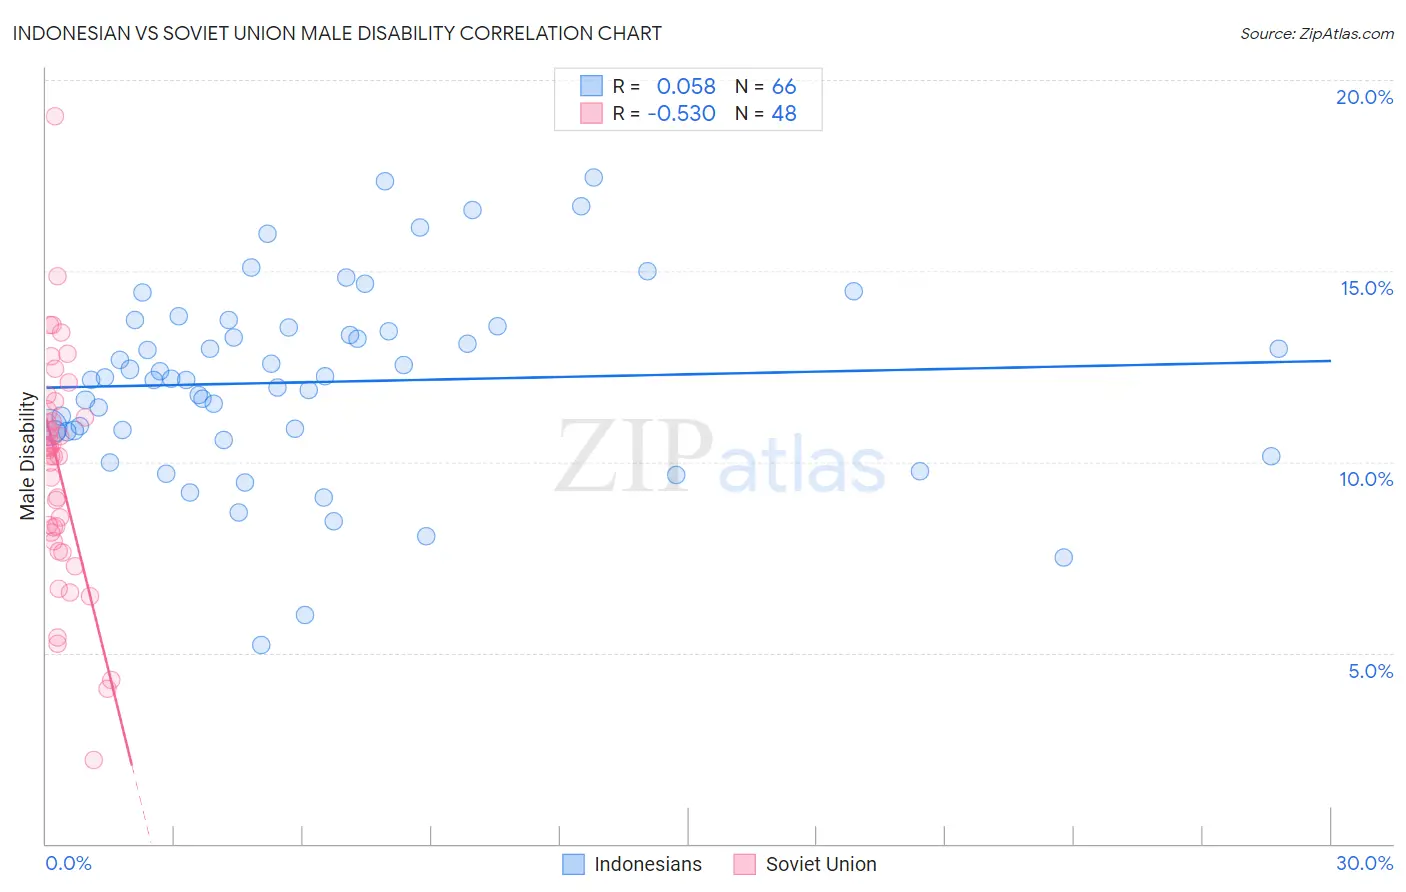
Indonesian vs Soviet Union Male Disability Correlation Chart
The statistical analysis conducted on geographies consisting of 162,722,294 people shows a slight positive correlation between the proportion of Indonesians and percentage of males with a disability in the United States with a correlation coefficient (R) of 0.058 and weighted average of 11.6%. Similarly, the statistical analysis conducted on geographies consisting of 43,487,843 people shows a substantial negative correlation between the proportion of Soviet Union and percentage of males with a disability in the United States with a correlation coefficient (R) of -0.530 and weighted average of 10.1%, a difference of 15.1%.
Male Disability Correlation Summary
| Measurement | Indonesian | Soviet Union |
| Minimum | 5.2% | 2.2% |
| Maximum | 17.5% | 19.1% |
| Range | 12.2% | 16.9% |
| Mean | 12.1% | 9.8% |
| Median | 12.2% | 10.2% |
| Interquartile 25% (IQ1) | 10.8% | 8.0% |
| Interquartile 75% (IQ3) | 13.5% | 11.2% |
| Interquartile Range (IQR) | 2.7% | 3.2% |
| Standard Deviation (Sample) | 2.5% | 3.0% |
| Standard Deviation (Population) | 2.5% | 3.0% |
Similar Demographics by Male Disability
Demographics Similar to Indonesians by Male Disability
In terms of male disability, the demographic groups most similar to Indonesians are Lithuanian (11.6%, a difference of 0.16%), Immigrants from Dominican Republic (11.7%, a difference of 0.28%), Immigrants from Dominica (11.7%, a difference of 0.34%), Mexican American Indian (11.6%, a difference of 0.40%), and Immigrants from Scotland (11.6%, a difference of 0.48%).
| Demographics | Rating | Rank | Male Disability |
| Icelanders | 10.1 /100 | #208 | Poor 11.6% |
| Spanish American Indians | 10.1 /100 | #209 | Poor 11.6% |
| Ute | 9.4 /100 | #210 | Tragic 11.6% |
| Immigrants | Thailand | 8.4 /100 | #211 | Tragic 11.6% |
| Immigrants | Scotland | 8.2 /100 | #212 | Tragic 11.6% |
| Mexican American Indians | 7.8 /100 | #213 | Tragic 11.6% |
| Lithuanians | 6.6 /100 | #214 | Tragic 11.6% |
| Indonesians | 5.9 /100 | #215 | Tragic 11.6% |
| Immigrants | Dominican Republic | 4.9 /100 | #216 | Tragic 11.7% |
| Immigrants | Dominica | 4.6 /100 | #217 | Tragic 11.7% |
| Immigrants | England | 4.0 /100 | #218 | Tragic 11.7% |
| Panamanians | 3.8 /100 | #219 | Tragic 11.7% |
| Immigrants | Western Europe | 3.8 /100 | #220 | Tragic 11.7% |
| Immigrants | Congo | 3.7 /100 | #221 | Tragic 11.7% |
| Alsatians | 3.3 /100 | #222 | Tragic 11.7% |
Demographics Similar to Soviet Union by Male Disability
In terms of male disability, the demographic groups most similar to Soviet Union are Immigrants from Egypt (10.1%, a difference of 0.070%), Venezuelan (10.1%, a difference of 0.10%), Argentinean (10.1%, a difference of 0.15%), Vietnamese (10.1%, a difference of 0.26%), and Egyptian (10.1%, a difference of 0.28%).
| Demographics | Rating | Rank | Male Disability |
| Immigrants | Asia | 100.0 /100 | #24 | Exceptional 10.0% |
| Immigrants | Malaysia | 99.9 /100 | #25 | Exceptional 10.0% |
| Paraguayans | 99.9 /100 | #26 | Exceptional 10.1% |
| Egyptians | 99.9 /100 | #27 | Exceptional 10.1% |
| Vietnamese | 99.9 /100 | #28 | Exceptional 10.1% |
| Venezuelans | 99.9 /100 | #29 | Exceptional 10.1% |
| Immigrants | Egypt | 99.9 /100 | #30 | Exceptional 10.1% |
| Soviet Union | 99.9 /100 | #31 | Exceptional 10.1% |
| Argentineans | 99.9 /100 | #32 | Exceptional 10.1% |
| Immigrants | Ethiopia | 99.9 /100 | #33 | Exceptional 10.2% |
| Immigrants | Turkey | 99.9 /100 | #34 | Exceptional 10.2% |
| Immigrants | Argentina | 99.9 /100 | #35 | Exceptional 10.2% |
| Ethiopians | 99.8 /100 | #36 | Exceptional 10.2% |
| Immigrants | Indonesia | 99.8 /100 | #37 | Exceptional 10.2% |
| Immigrants | Kuwait | 99.8 /100 | #38 | Exceptional 10.2% |