Honduran vs Soviet Union Male Disability
COMPARE
Honduran
Soviet Union
Male Disability
Male Disability Comparison
Hondurans
Soviet Union
11.3%
MALE DISABILITY
41.1/ 100
METRIC RATING
180th/ 347
METRIC RANK
10.1%
MALE DISABILITY
99.9/ 100
METRIC RATING
31st/ 347
METRIC RANK
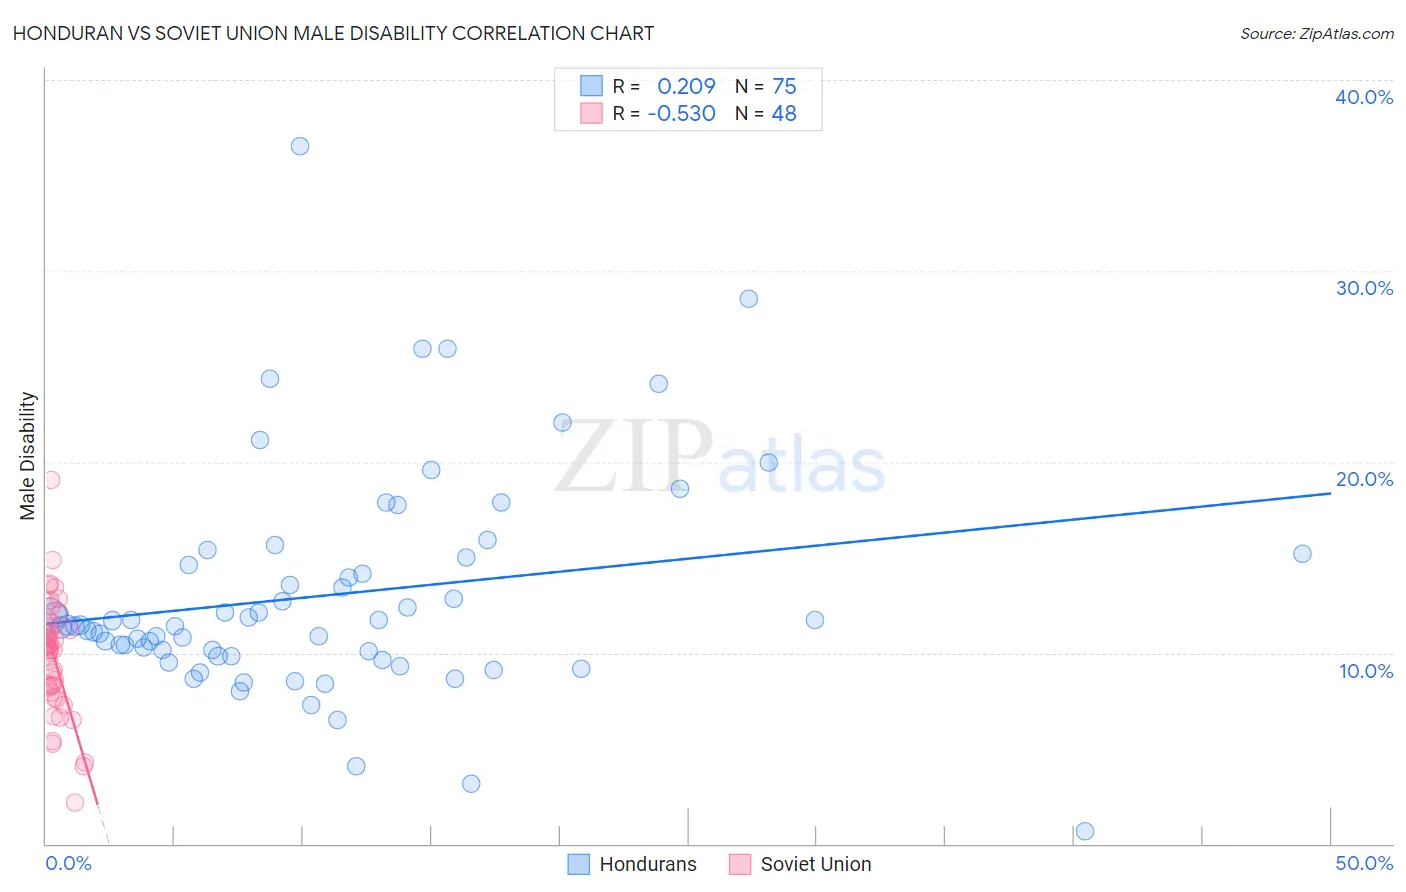
Honduran vs Soviet Union Male Disability Correlation Chart
The statistical analysis conducted on geographies consisting of 357,765,878 people shows a weak positive correlation between the proportion of Hondurans and percentage of males with a disability in the United States with a correlation coefficient (R) of 0.209 and weighted average of 11.3%. Similarly, the statistical analysis conducted on geographies consisting of 43,487,843 people shows a substantial negative correlation between the proportion of Soviet Union and percentage of males with a disability in the United States with a correlation coefficient (R) of -0.530 and weighted average of 10.1%, a difference of 11.4%.
Male Disability Correlation Summary
| Measurement | Honduran | Soviet Union |
| Minimum | 0.65% | 2.2% |
| Maximum | 36.5% | 19.1% |
| Range | 35.9% | 16.9% |
| Mean | 13.0% | 9.8% |
| Median | 11.4% | 10.2% |
| Interquartile 25% (IQ1) | 9.8% | 8.0% |
| Interquartile 75% (IQ3) | 15.0% | 11.2% |
| Interquartile Range (IQR) | 5.1% | 3.2% |
| Standard Deviation (Sample) | 5.8% | 3.0% |
| Standard Deviation (Population) | 5.8% | 3.0% |
Similar Demographics by Male Disability
Demographics Similar to Hondurans by Male Disability
In terms of male disability, the demographic groups most similar to Hondurans are Immigrants from Caribbean (11.3%, a difference of 0.020%), Australian (11.3%, a difference of 0.060%), Immigrants from Norway (11.3%, a difference of 0.17%), Syrian (11.2%, a difference of 0.31%), and Immigrants from Senegal (11.3%, a difference of 0.40%).
| Demographics | Rating | Rank | Male Disability |
| Immigrants | Burma/Myanmar | 50.4 /100 | #173 | Average 11.2% |
| Maltese | 50.0 /100 | #174 | Average 11.2% |
| Immigrants | Honduras | 48.7 /100 | #175 | Average 11.2% |
| Syrians | 46.6 /100 | #176 | Average 11.2% |
| Immigrants | Norway | 44.2 /100 | #177 | Average 11.3% |
| Australians | 42.2 /100 | #178 | Average 11.3% |
| Immigrants | Caribbean | 41.4 /100 | #179 | Average 11.3% |
| Hondurans | 41.1 /100 | #180 | Average 11.3% |
| Immigrants | Senegal | 34.4 /100 | #181 | Fair 11.3% |
| Immigrants | Belize | 33.7 /100 | #182 | Fair 11.3% |
| Immigrants | Central America | 32.9 /100 | #183 | Fair 11.3% |
| Iraqis | 30.5 /100 | #184 | Fair 11.3% |
| Pakistanis | 30.3 /100 | #185 | Fair 11.3% |
| Immigrants | Zaire | 27.6 /100 | #186 | Fair 11.4% |
| Immigrants | Austria | 27.3 /100 | #187 | Fair 11.4% |
Demographics Similar to Soviet Union by Male Disability
In terms of male disability, the demographic groups most similar to Soviet Union are Immigrants from Egypt (10.1%, a difference of 0.070%), Venezuelan (10.1%, a difference of 0.10%), Argentinean (10.1%, a difference of 0.15%), Vietnamese (10.1%, a difference of 0.26%), and Egyptian (10.1%, a difference of 0.28%).
| Demographics | Rating | Rank | Male Disability |
| Immigrants | Asia | 100.0 /100 | #24 | Exceptional 10.0% |
| Immigrants | Malaysia | 99.9 /100 | #25 | Exceptional 10.0% |
| Paraguayans | 99.9 /100 | #26 | Exceptional 10.1% |
| Egyptians | 99.9 /100 | #27 | Exceptional 10.1% |
| Vietnamese | 99.9 /100 | #28 | Exceptional 10.1% |
| Venezuelans | 99.9 /100 | #29 | Exceptional 10.1% |
| Immigrants | Egypt | 99.9 /100 | #30 | Exceptional 10.1% |
| Soviet Union | 99.9 /100 | #31 | Exceptional 10.1% |
| Argentineans | 99.9 /100 | #32 | Exceptional 10.1% |
| Immigrants | Ethiopia | 99.9 /100 | #33 | Exceptional 10.2% |
| Immigrants | Turkey | 99.9 /100 | #34 | Exceptional 10.2% |
| Immigrants | Argentina | 99.9 /100 | #35 | Exceptional 10.2% |
| Ethiopians | 99.8 /100 | #36 | Exceptional 10.2% |
| Immigrants | Indonesia | 99.8 /100 | #37 | Exceptional 10.2% |
| Immigrants | Kuwait | 99.8 /100 | #38 | Exceptional 10.2% |