Scandinavian vs Immigrants from Middle Africa Male Disability
COMPARE
Scandinavian
Immigrants from Middle Africa
Male Disability
Male Disability Comparison
Scandinavians
Immigrants from Middle Africa
12.3%
MALE DISABILITY
0.1/ 100
METRIC RATING
271st/ 347
METRIC RANK
11.1%
MALE DISABILITY
70.9/ 100
METRIC RATING
155th/ 347
METRIC RANK
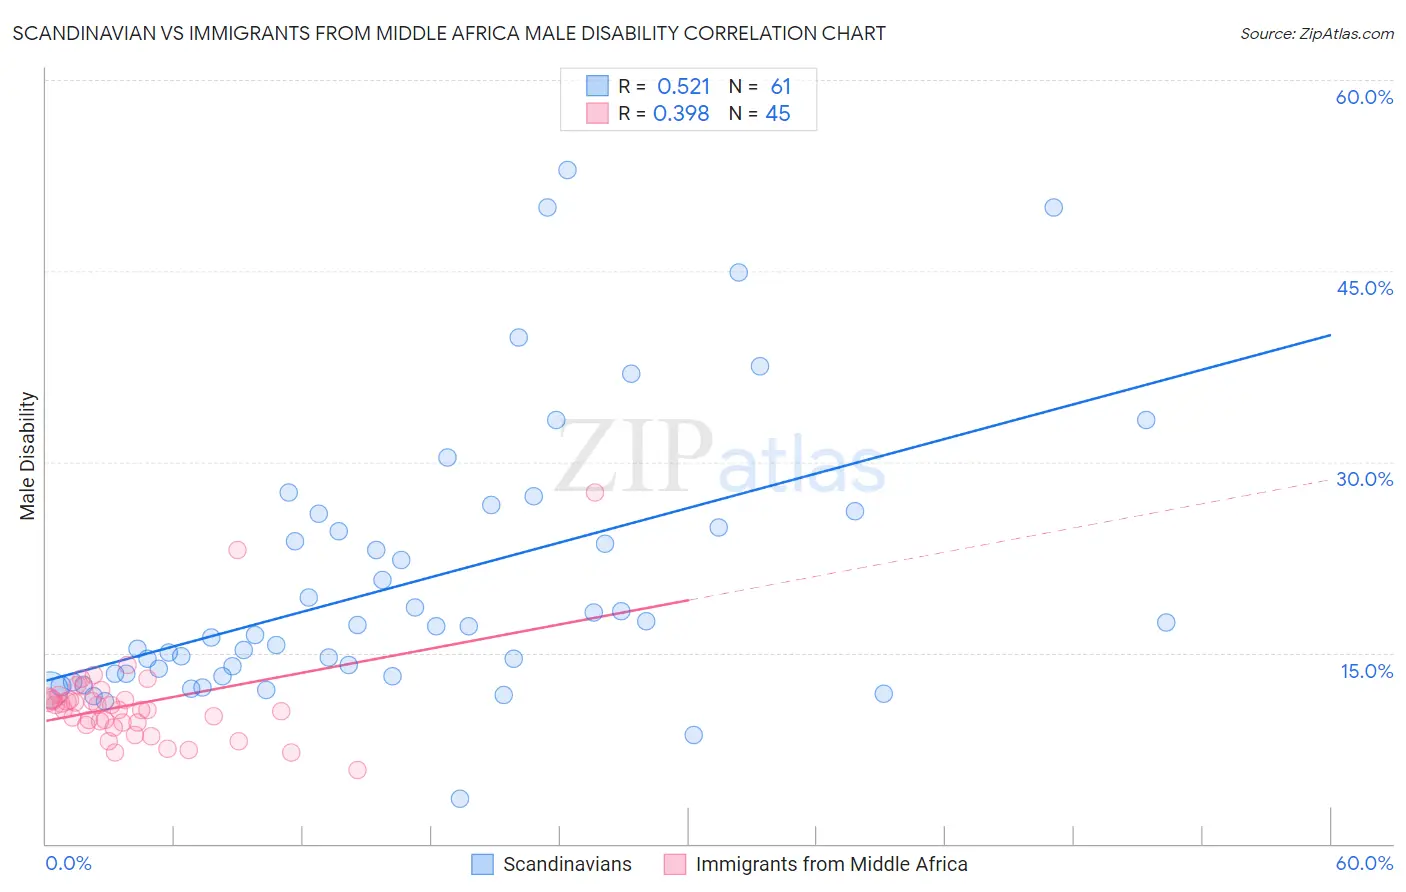
Scandinavian vs Immigrants from Middle Africa Male Disability Correlation Chart
The statistical analysis conducted on geographies consisting of 472,512,703 people shows a substantial positive correlation between the proportion of Scandinavians and percentage of males with a disability in the United States with a correlation coefficient (R) of 0.521 and weighted average of 12.3%. Similarly, the statistical analysis conducted on geographies consisting of 202,727,084 people shows a mild positive correlation between the proportion of Immigrants from Middle Africa and percentage of males with a disability in the United States with a correlation coefficient (R) of 0.398 and weighted average of 11.1%, a difference of 11.2%.
Male Disability Correlation Summary
| Measurement | Scandinavian | Immigrants from Middle Africa |
| Minimum | 3.5% | 5.8% |
| Maximum | 52.9% | 27.6% |
| Range | 49.4% | 21.8% |
| Mean | 20.6% | 11.0% |
| Median | 17.0% | 10.5% |
| Interquartile 25% (IQ1) | 13.3% | 9.4% |
| Interquartile 75% (IQ3) | 25.4% | 11.3% |
| Interquartile Range (IQR) | 12.1% | 1.9% |
| Standard Deviation (Sample) | 10.7% | 3.6% |
| Standard Deviation (Population) | 10.7% | 3.6% |
Similar Demographics by Male Disability
Demographics Similar to Scandinavians by Male Disability
In terms of male disability, the demographic groups most similar to Scandinavians are Spaniard (12.3%, a difference of 0.19%), Portuguese (12.3%, a difference of 0.27%), Czechoslovakian (12.3%, a difference of 0.27%), Immigrants from Germany (12.3%, a difference of 0.40%), and Hawaiian (12.3%, a difference of 0.45%).
| Demographics | Rating | Rank | Male Disability |
| Nepalese | 0.2 /100 | #264 | Tragic 12.2% |
| Immigrants | Portugal | 0.1 /100 | #265 | Tragic 12.3% |
| Hawaiians | 0.1 /100 | #266 | Tragic 12.3% |
| Immigrants | Germany | 0.1 /100 | #267 | Tragic 12.3% |
| Portuguese | 0.1 /100 | #268 | Tragic 12.3% |
| Czechoslovakians | 0.1 /100 | #269 | Tragic 12.3% |
| Spaniards | 0.1 /100 | #270 | Tragic 12.3% |
| Scandinavians | 0.1 /100 | #271 | Tragic 12.3% |
| Hmong | 0.0 /100 | #272 | Tragic 12.5% |
| Native Hawaiians | 0.0 /100 | #273 | Tragic 12.5% |
| Hopi | 0.0 /100 | #274 | Tragic 12.5% |
| Fijians | 0.0 /100 | #275 | Tragic 12.6% |
| Africans | 0.0 /100 | #276 | Tragic 12.6% |
| Finns | 0.0 /100 | #277 | Tragic 12.6% |
| Central American Indians | 0.0 /100 | #278 | Tragic 12.7% |
Demographics Similar to Immigrants from Middle Africa by Male Disability
In terms of male disability, the demographic groups most similar to Immigrants from Middle Africa are Russian (11.1%, a difference of 0.070%), Immigrants from Western Africa (11.1%, a difference of 0.11%), Immigrants from Moldova (11.1%, a difference of 0.14%), Immigrants from Northern Europe (11.1%, a difference of 0.16%), and Latvian (11.1%, a difference of 0.18%).
| Demographics | Rating | Rank | Male Disability |
| Sudanese | 77.1 /100 | #148 | Good 11.0% |
| Immigrants | Denmark | 76.4 /100 | #149 | Good 11.0% |
| Immigrants | Guatemala | 75.1 /100 | #150 | Good 11.0% |
| Cubans | 74.9 /100 | #151 | Good 11.0% |
| Immigrants | Albania | 74.4 /100 | #152 | Good 11.0% |
| Immigrants | Northern Europe | 73.2 /100 | #153 | Good 11.1% |
| Immigrants | Moldova | 72.8 /100 | #154 | Good 11.1% |
| Immigrants | Middle Africa | 70.9 /100 | #155 | Good 11.1% |
| Russians | 69.8 /100 | #156 | Good 11.1% |
| Immigrants | Western Africa | 69.2 /100 | #157 | Good 11.1% |
| Latvians | 68.1 /100 | #158 | Good 11.1% |
| Guatemalans | 67.2 /100 | #159 | Good 11.1% |
| Albanians | 66.5 /100 | #160 | Good 11.1% |
| Immigrants | West Indies | 65.7 /100 | #161 | Good 11.1% |
| Immigrants | Haiti | 65.3 /100 | #162 | Good 11.1% |