Laotian vs Soviet Union Male Disability
COMPARE
Laotian
Soviet Union
Male Disability
Male Disability Comparison
Laotians
Soviet Union
10.6%
MALE DISABILITY
98.6/ 100
METRIC RATING
77th/ 347
METRIC RANK
10.1%
MALE DISABILITY
99.9/ 100
METRIC RATING
31st/ 347
METRIC RANK
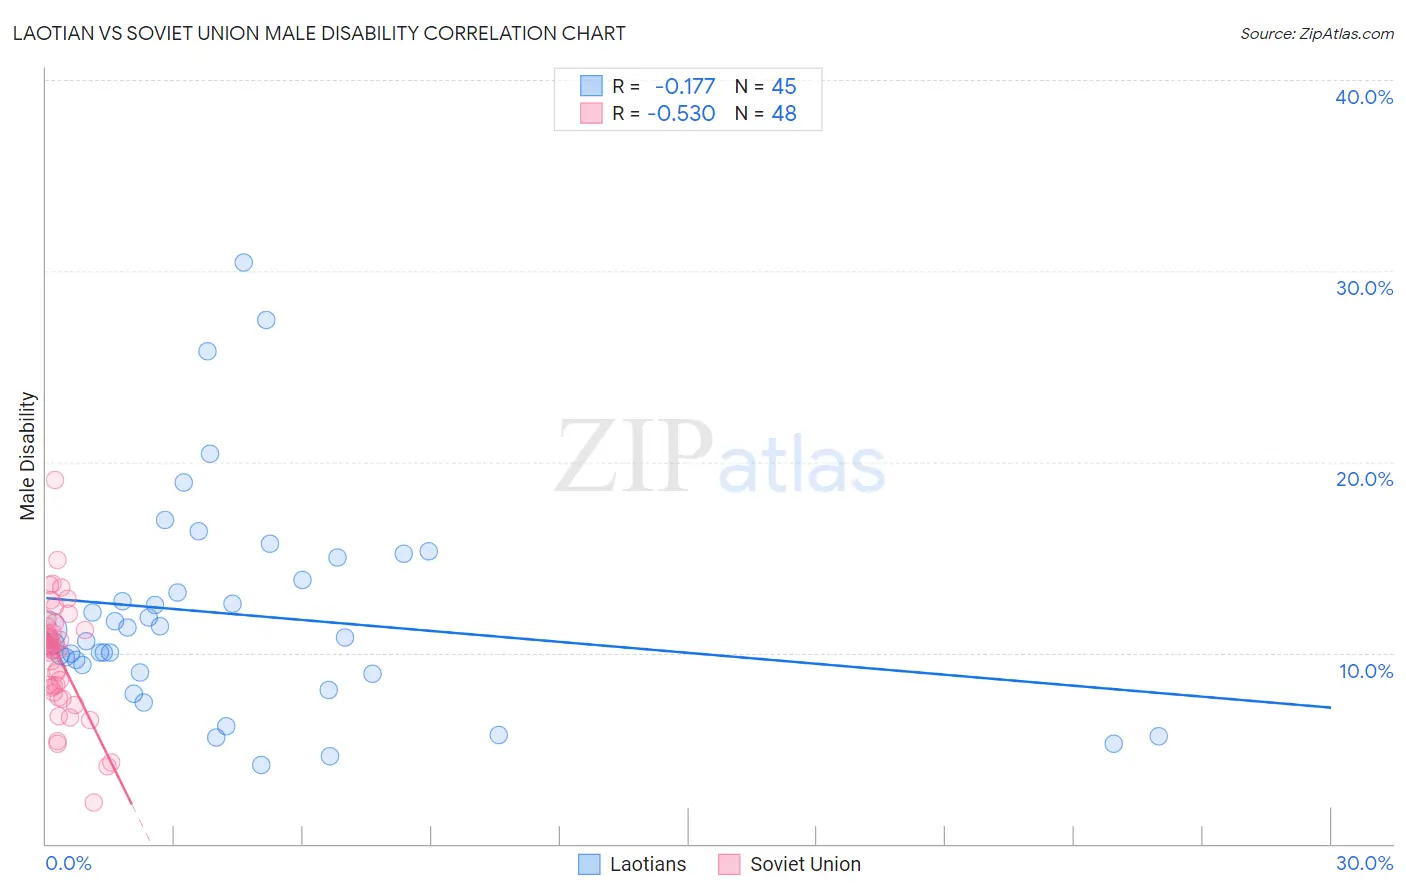
Laotian vs Soviet Union Male Disability Correlation Chart
The statistical analysis conducted on geographies consisting of 224,854,560 people shows a poor negative correlation between the proportion of Laotians and percentage of males with a disability in the United States with a correlation coefficient (R) of -0.177 and weighted average of 10.6%. Similarly, the statistical analysis conducted on geographies consisting of 43,487,843 people shows a substantial negative correlation between the proportion of Soviet Union and percentage of males with a disability in the United States with a correlation coefficient (R) of -0.530 and weighted average of 10.1%, a difference of 4.3%.
Male Disability Correlation Summary
| Measurement | Laotian | Soviet Union |
| Minimum | 4.1% | 2.2% |
| Maximum | 30.4% | 19.1% |
| Range | 26.3% | 16.9% |
| Mean | 12.0% | 9.8% |
| Median | 10.8% | 10.2% |
| Interquartile 25% (IQ1) | 9.0% | 8.0% |
| Interquartile 75% (IQ3) | 14.4% | 11.2% |
| Interquartile Range (IQR) | 5.4% | 3.2% |
| Standard Deviation (Sample) | 5.7% | 3.0% |
| Standard Deviation (Population) | 5.6% | 3.0% |
Similar Demographics by Male Disability
Demographics Similar to Laotians by Male Disability
In terms of male disability, the demographic groups most similar to Laotians are Immigrants from Russia (10.6%, a difference of 0.020%), Immigrants from Sierra Leone (10.5%, a difference of 0.060%), Sierra Leonean (10.5%, a difference of 0.10%), Immigrants from Lebanon (10.5%, a difference of 0.21%), and Zimbabwean (10.6%, a difference of 0.25%).
| Demographics | Rating | Rank | Male Disability |
| Immigrants | Bulgaria | 99.1 /100 | #70 | Exceptional 10.5% |
| Immigrants | Cameroon | 99.0 /100 | #71 | Exceptional 10.5% |
| Immigrants | Serbia | 99.0 /100 | #72 | Exceptional 10.5% |
| Immigrants | Lithuania | 98.9 /100 | #73 | Exceptional 10.5% |
| Immigrants | Lebanon | 98.8 /100 | #74 | Exceptional 10.5% |
| Sierra Leoneans | 98.7 /100 | #75 | Exceptional 10.5% |
| Immigrants | Sierra Leone | 98.7 /100 | #76 | Exceptional 10.5% |
| Laotians | 98.6 /100 | #77 | Exceptional 10.6% |
| Immigrants | Russia | 98.6 /100 | #78 | Exceptional 10.6% |
| Zimbabweans | 98.4 /100 | #79 | Exceptional 10.6% |
| Immigrants | Jordan | 98.4 /100 | #80 | Exceptional 10.6% |
| Immigrants | Chile | 98.3 /100 | #81 | Exceptional 10.6% |
| Immigrants | Guyana | 98.2 /100 | #82 | Exceptional 10.6% |
| Immigrants | Poland | 98.1 /100 | #83 | Exceptional 10.6% |
| Bulgarians | 98.1 /100 | #84 | Exceptional 10.6% |
Demographics Similar to Soviet Union by Male Disability
In terms of male disability, the demographic groups most similar to Soviet Union are Immigrants from Egypt (10.1%, a difference of 0.070%), Venezuelan (10.1%, a difference of 0.10%), Argentinean (10.1%, a difference of 0.15%), Vietnamese (10.1%, a difference of 0.26%), and Egyptian (10.1%, a difference of 0.28%).
| Demographics | Rating | Rank | Male Disability |
| Immigrants | Asia | 100.0 /100 | #24 | Exceptional 10.0% |
| Immigrants | Malaysia | 99.9 /100 | #25 | Exceptional 10.0% |
| Paraguayans | 99.9 /100 | #26 | Exceptional 10.1% |
| Egyptians | 99.9 /100 | #27 | Exceptional 10.1% |
| Vietnamese | 99.9 /100 | #28 | Exceptional 10.1% |
| Venezuelans | 99.9 /100 | #29 | Exceptional 10.1% |
| Immigrants | Egypt | 99.9 /100 | #30 | Exceptional 10.1% |
| Soviet Union | 99.9 /100 | #31 | Exceptional 10.1% |
| Argentineans | 99.9 /100 | #32 | Exceptional 10.1% |
| Immigrants | Ethiopia | 99.9 /100 | #33 | Exceptional 10.2% |
| Immigrants | Turkey | 99.9 /100 | #34 | Exceptional 10.2% |
| Immigrants | Argentina | 99.9 /100 | #35 | Exceptional 10.2% |
| Ethiopians | 99.8 /100 | #36 | Exceptional 10.2% |
| Immigrants | Indonesia | 99.8 /100 | #37 | Exceptional 10.2% |
| Immigrants | Kuwait | 99.8 /100 | #38 | Exceptional 10.2% |