Scandinavian vs Immigrants from Iran Male Disability
COMPARE
Scandinavian
Immigrants from Iran
Male Disability
Male Disability Comparison
Scandinavians
Immigrants from Iran
12.3%
MALE DISABILITY
0.1/ 100
METRIC RATING
271st/ 347
METRIC RANK
9.7%
MALE DISABILITY
100.0/ 100
METRIC RATING
14th/ 347
METRIC RANK
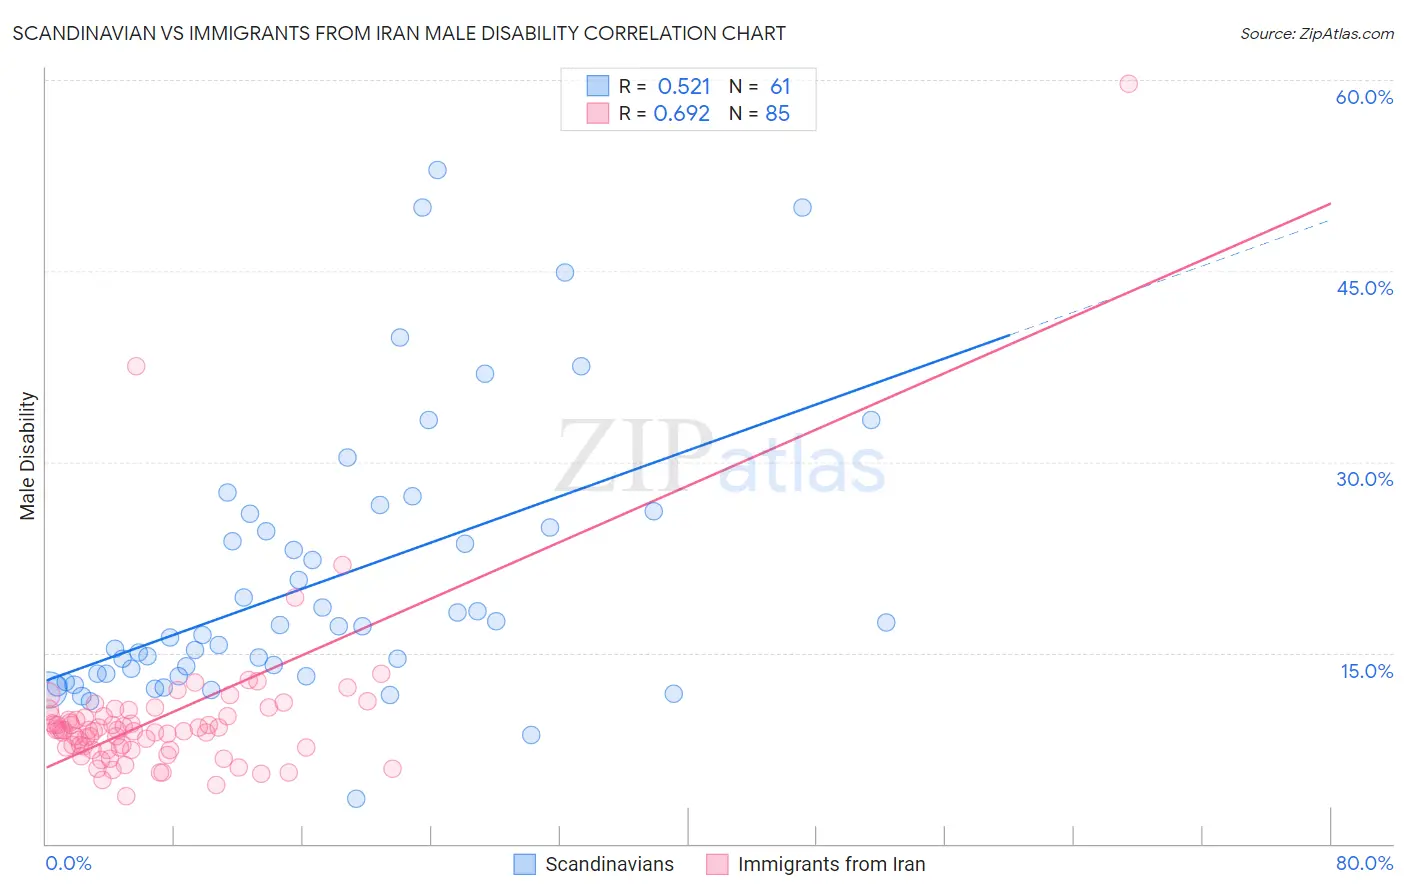
Scandinavian vs Immigrants from Iran Male Disability Correlation Chart
The statistical analysis conducted on geographies consisting of 472,512,703 people shows a substantial positive correlation between the proportion of Scandinavians and percentage of males with a disability in the United States with a correlation coefficient (R) of 0.521 and weighted average of 12.3%. Similarly, the statistical analysis conducted on geographies consisting of 279,892,018 people shows a significant positive correlation between the proportion of Immigrants from Iran and percentage of males with a disability in the United States with a correlation coefficient (R) of 0.692 and weighted average of 9.7%, a difference of 27.4%.
Male Disability Correlation Summary
| Measurement | Scandinavian | Immigrants from Iran |
| Minimum | 3.5% | 3.8% |
| Maximum | 52.9% | 59.7% |
| Range | 49.4% | 55.9% |
| Mean | 20.6% | 9.9% |
| Median | 17.0% | 8.9% |
| Interquartile 25% (IQ1) | 13.3% | 7.5% |
| Interquartile 75% (IQ3) | 25.4% | 10.1% |
| Interquartile Range (IQR) | 12.1% | 2.6% |
| Standard Deviation (Sample) | 10.7% | 6.8% |
| Standard Deviation (Population) | 10.7% | 6.8% |
Similar Demographics by Male Disability
Demographics Similar to Scandinavians by Male Disability
In terms of male disability, the demographic groups most similar to Scandinavians are Spaniard (12.3%, a difference of 0.19%), Portuguese (12.3%, a difference of 0.27%), Czechoslovakian (12.3%, a difference of 0.27%), Immigrants from Germany (12.3%, a difference of 0.40%), and Hawaiian (12.3%, a difference of 0.45%).
| Demographics | Rating | Rank | Male Disability |
| Nepalese | 0.2 /100 | #264 | Tragic 12.2% |
| Immigrants | Portugal | 0.1 /100 | #265 | Tragic 12.3% |
| Hawaiians | 0.1 /100 | #266 | Tragic 12.3% |
| Immigrants | Germany | 0.1 /100 | #267 | Tragic 12.3% |
| Portuguese | 0.1 /100 | #268 | Tragic 12.3% |
| Czechoslovakians | 0.1 /100 | #269 | Tragic 12.3% |
| Spaniards | 0.1 /100 | #270 | Tragic 12.3% |
| Scandinavians | 0.1 /100 | #271 | Tragic 12.3% |
| Hmong | 0.0 /100 | #272 | Tragic 12.5% |
| Native Hawaiians | 0.0 /100 | #273 | Tragic 12.5% |
| Hopi | 0.0 /100 | #274 | Tragic 12.5% |
| Fijians | 0.0 /100 | #275 | Tragic 12.6% |
| Africans | 0.0 /100 | #276 | Tragic 12.6% |
| Finns | 0.0 /100 | #277 | Tragic 12.6% |
| Central American Indians | 0.0 /100 | #278 | Tragic 12.7% |
Demographics Similar to Immigrants from Iran by Male Disability
In terms of male disability, the demographic groups most similar to Immigrants from Iran are Iranian (9.7%, a difference of 0.10%), Bolivian (9.6%, a difference of 0.33%), Indian (Asian) (9.7%, a difference of 0.45%), Immigrants from Eastern Asia (9.6%, a difference of 0.56%), and Okinawan (9.8%, a difference of 1.1%).
| Demographics | Rating | Rank | Male Disability |
| Immigrants | Bolivia | 100.0 /100 | #7 | Exceptional 9.5% |
| Immigrants | China | 100.0 /100 | #8 | Exceptional 9.5% |
| Immigrants | Singapore | 100.0 /100 | #9 | Exceptional 9.5% |
| Immigrants | Israel | 100.0 /100 | #10 | Exceptional 9.6% |
| Immigrants | Eastern Asia | 100.0 /100 | #11 | Exceptional 9.6% |
| Bolivians | 100.0 /100 | #12 | Exceptional 9.6% |
| Iranians | 100.0 /100 | #13 | Exceptional 9.7% |
| Immigrants | Iran | 100.0 /100 | #14 | Exceptional 9.7% |
| Indians (Asian) | 100.0 /100 | #15 | Exceptional 9.7% |
| Okinawans | 100.0 /100 | #16 | Exceptional 9.8% |
| Immigrants | Korea | 100.0 /100 | #17 | Exceptional 9.8% |
| Immigrants | Pakistan | 100.0 /100 | #18 | Exceptional 9.8% |
| Immigrants | Sri Lanka | 100.0 /100 | #19 | Exceptional 10.0% |
| Asians | 100.0 /100 | #20 | Exceptional 10.0% |
| Burmese | 100.0 /100 | #21 | Exceptional 10.0% |