Scandinavian vs Spaniard Male Disability
COMPARE
Scandinavian
Spaniard
Male Disability
Male Disability Comparison
Scandinavians
Spaniards
12.3%
MALE DISABILITY
0.1/ 100
METRIC RATING
271st/ 347
METRIC RANK
12.3%
MALE DISABILITY
0.1/ 100
METRIC RATING
270th/ 347
METRIC RANK
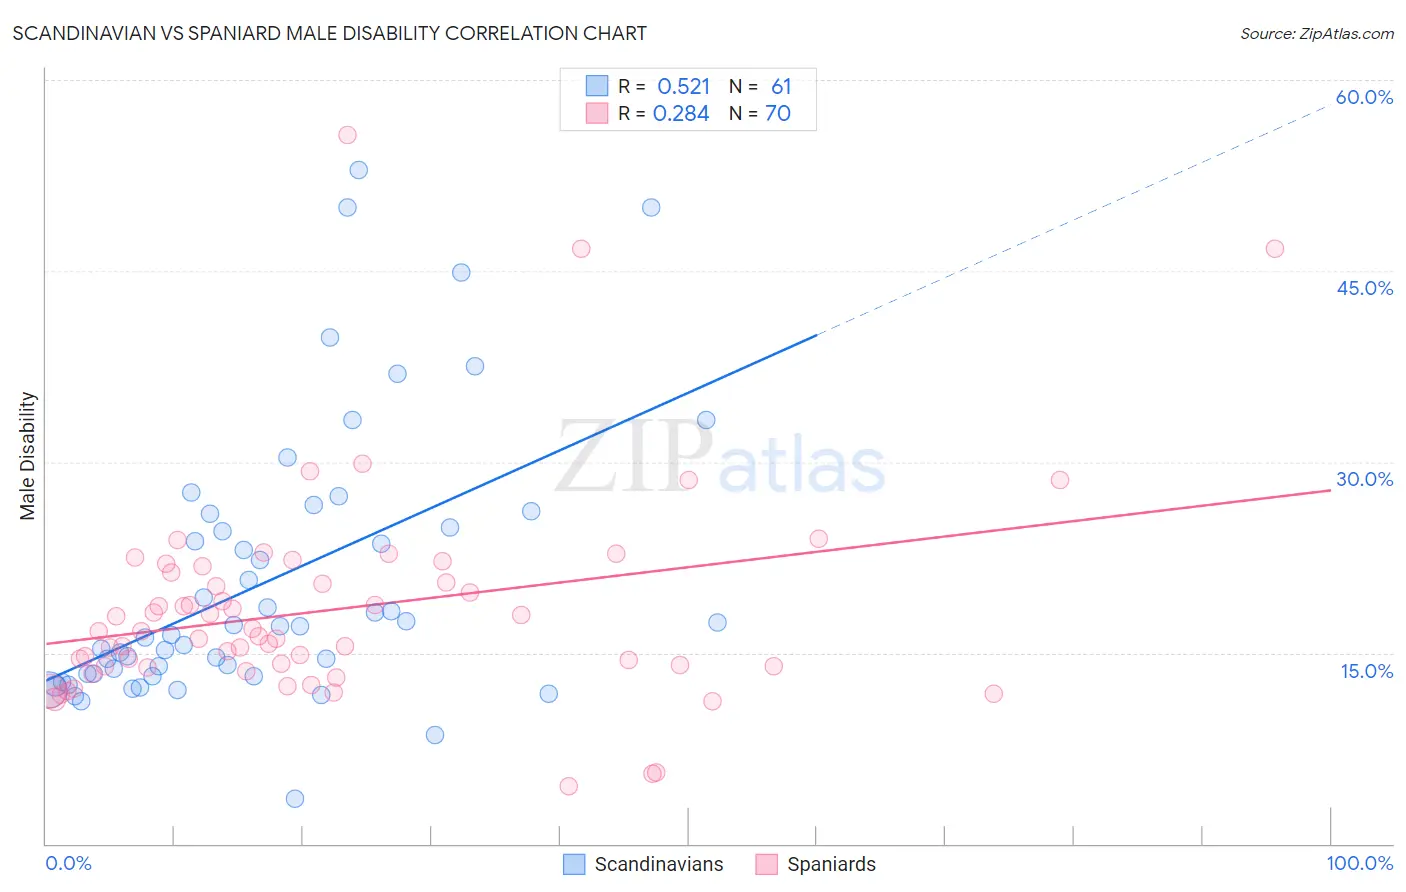
Scandinavian vs Spaniard Male Disability Correlation Chart
The statistical analysis conducted on geographies consisting of 472,512,703 people shows a substantial positive correlation between the proportion of Scandinavians and percentage of males with a disability in the United States with a correlation coefficient (R) of 0.521 and weighted average of 12.3%. Similarly, the statistical analysis conducted on geographies consisting of 443,401,909 people shows a weak positive correlation between the proportion of Spaniards and percentage of males with a disability in the United States with a correlation coefficient (R) of 0.284 and weighted average of 12.3%, a difference of 0.19%.
Male Disability Correlation Summary
| Measurement | Scandinavian | Spaniard |
| Minimum | 3.5% | 4.5% |
| Maximum | 52.9% | 55.7% |
| Range | 49.4% | 51.2% |
| Mean | 20.6% | 18.4% |
| Median | 17.0% | 16.5% |
| Interquartile 25% (IQ1) | 13.3% | 13.9% |
| Interquartile 75% (IQ3) | 25.4% | 21.3% |
| Interquartile Range (IQR) | 12.1% | 7.4% |
| Standard Deviation (Sample) | 10.7% | 8.5% |
| Standard Deviation (Population) | 10.7% | 8.4% |
Demographics Similar to Scandinavians and Spaniards by Male Disability
In terms of male disability, the demographic groups most similar to Scandinavians are Portuguese (12.3%, a difference of 0.27%), Czechoslovakian (12.3%, a difference of 0.27%), Immigrants from Germany (12.3%, a difference of 0.40%), Hawaiian (12.3%, a difference of 0.45%), and Immigrants from Portugal (12.3%, a difference of 0.47%). Similarly, the demographic groups most similar to Spaniards are Czechoslovakian (12.3%, a difference of 0.080%), Portuguese (12.3%, a difference of 0.090%), Immigrants from Germany (12.3%, a difference of 0.21%), Hawaiian (12.3%, a difference of 0.26%), and Immigrants from Portugal (12.3%, a difference of 0.28%).
| Demographics | Rating | Rank | Male Disability |
| Swedes | 0.3 /100 | #260 | Tragic 12.1% |
| Slavs | 0.2 /100 | #261 | Tragic 12.2% |
| Norwegians | 0.2 /100 | #262 | Tragic 12.2% |
| Canadians | 0.2 /100 | #263 | Tragic 12.2% |
| Nepalese | 0.2 /100 | #264 | Tragic 12.2% |
| Immigrants | Portugal | 0.1 /100 | #265 | Tragic 12.3% |
| Hawaiians | 0.1 /100 | #266 | Tragic 12.3% |
| Immigrants | Germany | 0.1 /100 | #267 | Tragic 12.3% |
| Portuguese | 0.1 /100 | #268 | Tragic 12.3% |
| Czechoslovakians | 0.1 /100 | #269 | Tragic 12.3% |
| Spaniards | 0.1 /100 | #270 | Tragic 12.3% |
| Scandinavians | 0.1 /100 | #271 | Tragic 12.3% |
| Hmong | 0.0 /100 | #272 | Tragic 12.5% |
| Native Hawaiians | 0.0 /100 | #273 | Tragic 12.5% |
| Hopi | 0.0 /100 | #274 | Tragic 12.5% |
| Fijians | 0.0 /100 | #275 | Tragic 12.6% |
| Africans | 0.0 /100 | #276 | Tragic 12.6% |
| Finns | 0.0 /100 | #277 | Tragic 12.6% |
| Central American Indians | 0.0 /100 | #278 | Tragic 12.7% |
| Slovaks | 0.0 /100 | #279 | Tragic 12.7% |
| Dutch | 0.0 /100 | #280 | Tragic 12.7% |