Scandinavian vs Carpatho Rusyn Male Disability
COMPARE
Scandinavian
Carpatho Rusyn
Male Disability
Male Disability Comparison
Scandinavians
Carpatho Rusyns
12.3%
MALE DISABILITY
0.1/ 100
METRIC RATING
271st/ 347
METRIC RANK
11.9%
MALE DISABILITY
1.3/ 100
METRIC RATING
237th/ 347
METRIC RANK
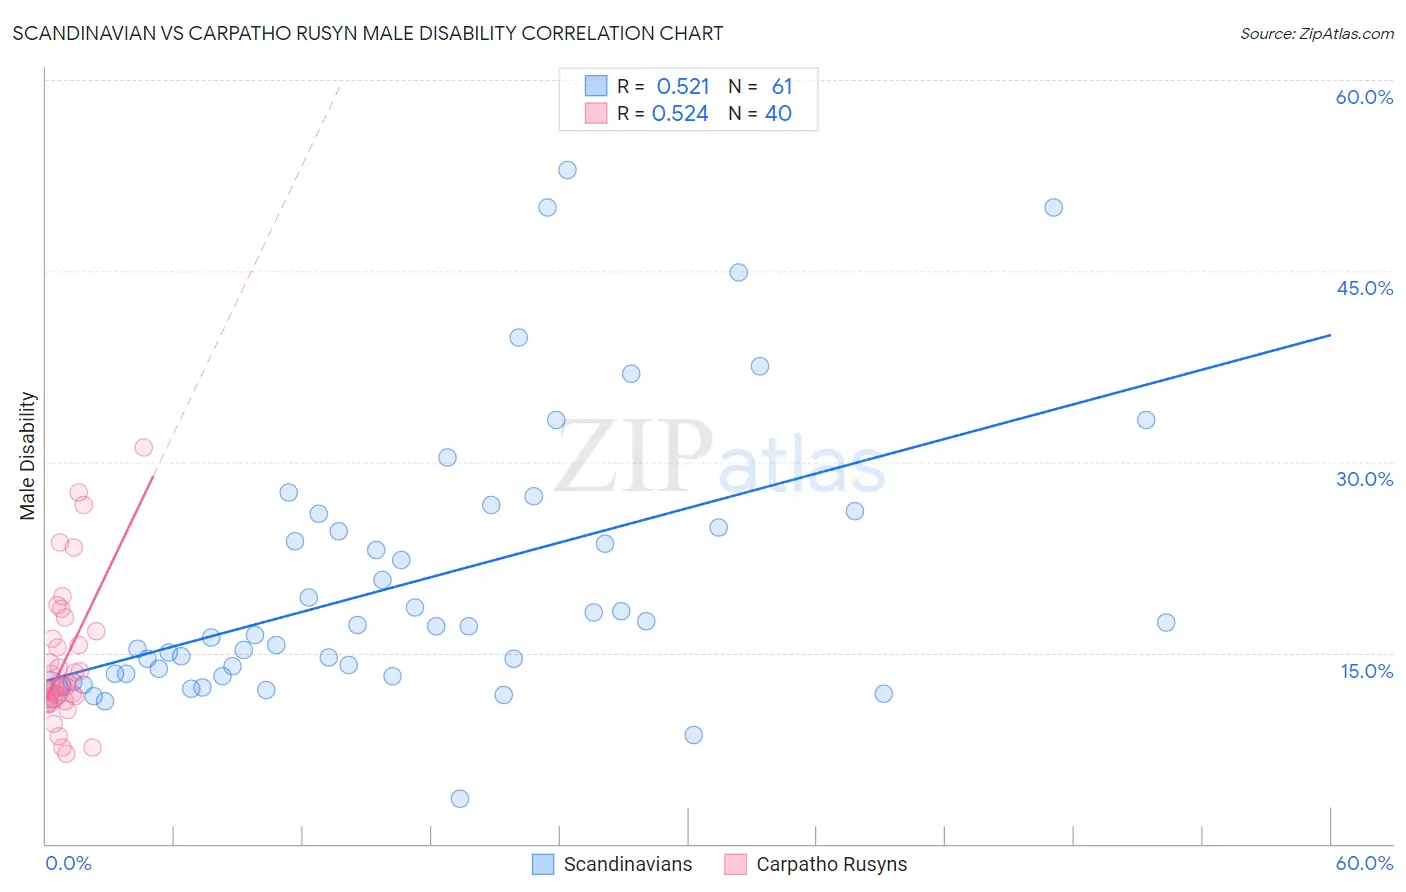
Scandinavian vs Carpatho Rusyn Male Disability Correlation Chart
The statistical analysis conducted on geographies consisting of 472,512,703 people shows a substantial positive correlation between the proportion of Scandinavians and percentage of males with a disability in the United States with a correlation coefficient (R) of 0.521 and weighted average of 12.3%. Similarly, the statistical analysis conducted on geographies consisting of 58,870,293 people shows a substantial positive correlation between the proportion of Carpatho Rusyns and percentage of males with a disability in the United States with a correlation coefficient (R) of 0.524 and weighted average of 11.9%, a difference of 3.6%.
Male Disability Correlation Summary
| Measurement | Scandinavian | Carpatho Rusyn |
| Minimum | 3.5% | 7.0% |
| Maximum | 52.9% | 31.1% |
| Range | 49.4% | 24.1% |
| Mean | 20.6% | 14.4% |
| Median | 17.0% | 12.4% |
| Interquartile 25% (IQ1) | 13.3% | 11.3% |
| Interquartile 75% (IQ3) | 25.4% | 16.4% |
| Interquartile Range (IQR) | 12.1% | 5.1% |
| Standard Deviation (Sample) | 10.7% | 5.5% |
| Standard Deviation (Population) | 10.7% | 5.5% |
Similar Demographics by Male Disability
Demographics Similar to Scandinavians by Male Disability
In terms of male disability, the demographic groups most similar to Scandinavians are Spaniard (12.3%, a difference of 0.19%), Portuguese (12.3%, a difference of 0.27%), Czechoslovakian (12.3%, a difference of 0.27%), Immigrants from Germany (12.3%, a difference of 0.40%), and Hawaiian (12.3%, a difference of 0.45%).
| Demographics | Rating | Rank | Male Disability |
| Nepalese | 0.2 /100 | #264 | Tragic 12.2% |
| Immigrants | Portugal | 0.1 /100 | #265 | Tragic 12.3% |
| Hawaiians | 0.1 /100 | #266 | Tragic 12.3% |
| Immigrants | Germany | 0.1 /100 | #267 | Tragic 12.3% |
| Portuguese | 0.1 /100 | #268 | Tragic 12.3% |
| Czechoslovakians | 0.1 /100 | #269 | Tragic 12.3% |
| Spaniards | 0.1 /100 | #270 | Tragic 12.3% |
| Scandinavians | 0.1 /100 | #271 | Tragic 12.3% |
| Hmong | 0.0 /100 | #272 | Tragic 12.5% |
| Native Hawaiians | 0.0 /100 | #273 | Tragic 12.5% |
| Hopi | 0.0 /100 | #274 | Tragic 12.5% |
| Fijians | 0.0 /100 | #275 | Tragic 12.6% |
| Africans | 0.0 /100 | #276 | Tragic 12.6% |
| Finns | 0.0 /100 | #277 | Tragic 12.6% |
| Central American Indians | 0.0 /100 | #278 | Tragic 12.7% |
Demographics Similar to Carpatho Rusyns by Male Disability
In terms of male disability, the demographic groups most similar to Carpatho Rusyns are U.S. Virgin Islander (11.9%, a difference of 0.010%), Yugoslavian (11.9%, a difference of 0.10%), Immigrants from North America (11.9%, a difference of 0.15%), Italian (11.9%, a difference of 0.15%), and Czech (11.9%, a difference of 0.20%).
| Demographics | Rating | Rank | Male Disability |
| Croatians | 2.1 /100 | #230 | Tragic 11.8% |
| Dominicans | 1.8 /100 | #231 | Tragic 11.8% |
| Malaysians | 1.8 /100 | #232 | Tragic 11.8% |
| Mexicans | 1.7 /100 | #233 | Tragic 11.8% |
| Immigrants | Canada | 1.6 /100 | #234 | Tragic 11.9% |
| Immigrants | North America | 1.5 /100 | #235 | Tragic 11.9% |
| U.S. Virgin Islanders | 1.3 /100 | #236 | Tragic 11.9% |
| Carpatho Rusyns | 1.3 /100 | #237 | Tragic 11.9% |
| Yugoslavians | 1.2 /100 | #238 | Tragic 11.9% |
| Italians | 1.2 /100 | #239 | Tragic 11.9% |
| Czechs | 1.1 /100 | #240 | Tragic 11.9% |
| Bahamians | 1.1 /100 | #241 | Tragic 11.9% |
| Northern Europeans | 1.1 /100 | #242 | Tragic 11.9% |
| Samoans | 1.1 /100 | #243 | Tragic 11.9% |
| Immigrants | Laos | 1.0 /100 | #244 | Tragic 11.9% |