West Indian vs Salvadoran Self-Care Disability
COMPARE
West Indian
Salvadoran
Self-Care Disability
Self-Care Disability Comparison
West Indians
Salvadorans
2.8%
SELF-CARE DISABILITY
0.0/ 100
METRIC RATING
297th/ 347
METRIC RANK
2.5%
SELF-CARE DISABILITY
36.4/ 100
METRIC RATING
183rd/ 347
METRIC RANK
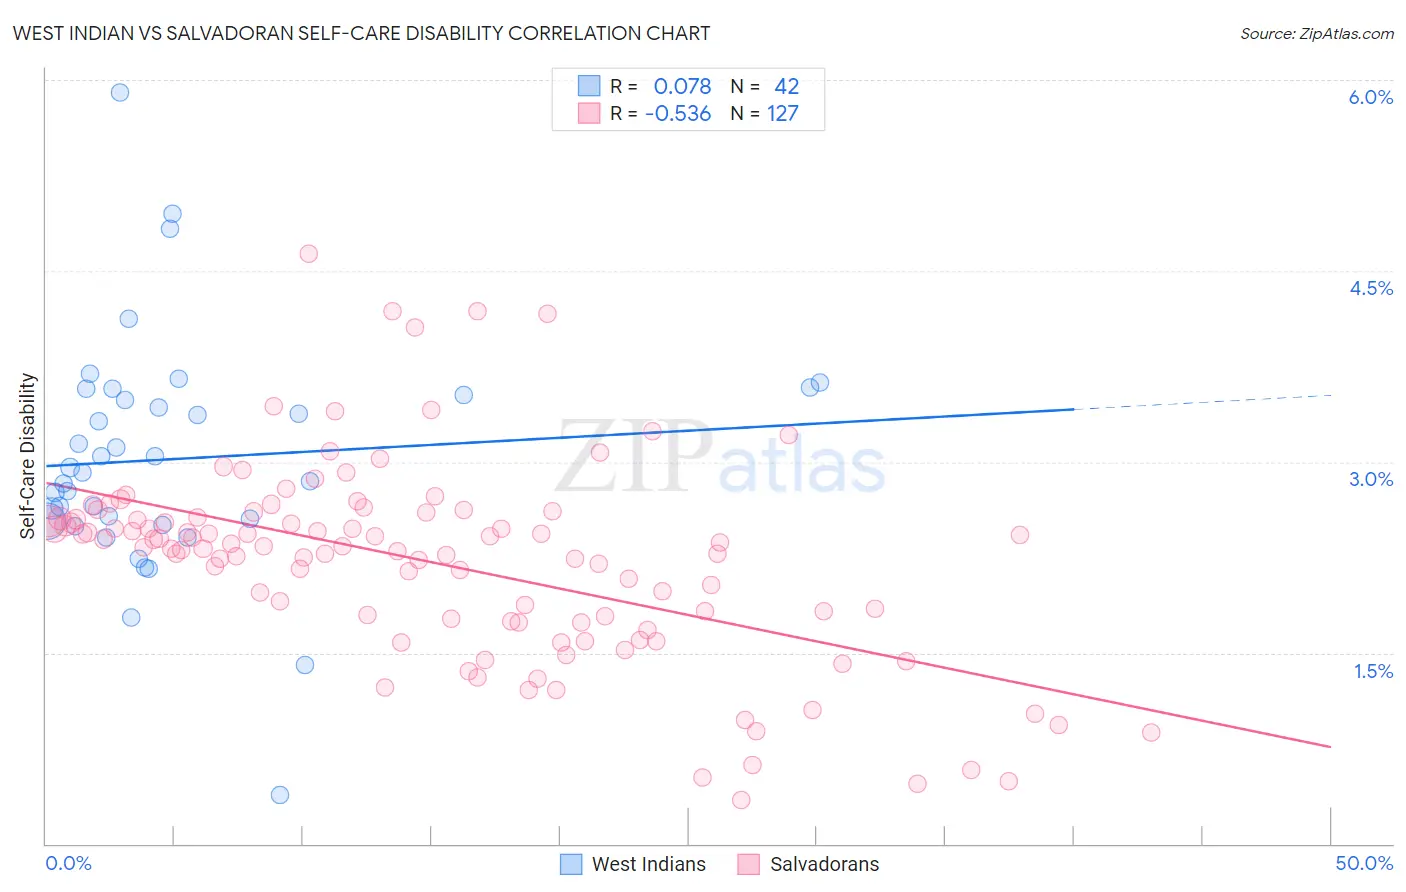
West Indian vs Salvadoran Self-Care Disability Correlation Chart
The statistical analysis conducted on geographies consisting of 253,805,677 people shows a slight positive correlation between the proportion of West Indians and percentage of population with self-care disability in the United States with a correlation coefficient (R) of 0.078 and weighted average of 2.8%. Similarly, the statistical analysis conducted on geographies consisting of 398,444,194 people shows a substantial negative correlation between the proportion of Salvadorans and percentage of population with self-care disability in the United States with a correlation coefficient (R) of -0.536 and weighted average of 2.5%, a difference of 11.2%.
Self-Care Disability Correlation Summary
| Measurement | West Indian | Salvadoran |
| Minimum | 0.38% | 0.35% |
| Maximum | 5.9% | 4.6% |
| Range | 5.5% | 4.3% |
| Mean | 3.0% | 2.2% |
| Median | 2.9% | 2.3% |
| Interquartile 25% (IQ1) | 2.5% | 1.8% |
| Interquartile 75% (IQ3) | 3.5% | 2.6% |
| Interquartile Range (IQR) | 1.00% | 0.81% |
| Standard Deviation (Sample) | 0.93% | 0.78% |
| Standard Deviation (Population) | 0.92% | 0.77% |
Similar Demographics by Self-Care Disability
Demographics Similar to West Indians by Self-Care Disability
In terms of self-care disability, the demographic groups most similar to West Indians are Immigrants from Portugal (2.8%, a difference of 0.090%), American (2.8%, a difference of 0.12%), Immigrants from Guyana (2.8%, a difference of 0.21%), Barbadian (2.7%, a difference of 0.51%), and Central American Indian (2.7%, a difference of 0.66%).
| Demographics | Rating | Rank | Self-Care Disability |
| Cubans | 0.0 /100 | #290 | Tragic 2.7% |
| Guyanese | 0.0 /100 | #291 | Tragic 2.7% |
| Central American Indians | 0.0 /100 | #292 | Tragic 2.7% |
| Belizeans | 0.0 /100 | #293 | Tragic 2.7% |
| Blackfeet | 0.0 /100 | #294 | Tragic 2.7% |
| Barbadians | 0.0 /100 | #295 | Tragic 2.7% |
| Immigrants | Portugal | 0.0 /100 | #296 | Tragic 2.8% |
| West Indians | 0.0 /100 | #297 | Tragic 2.8% |
| Americans | 0.0 /100 | #298 | Tragic 2.8% |
| Immigrants | Guyana | 0.0 /100 | #299 | Tragic 2.8% |
| Immigrants | Fiji | 0.0 /100 | #300 | Tragic 2.8% |
| Pima | 0.0 /100 | #301 | Tragic 2.8% |
| Immigrants | St. Vincent and the Grenadines | 0.0 /100 | #302 | Tragic 2.8% |
| Immigrants | Belize | 0.0 /100 | #303 | Tragic 2.8% |
| Cree | 0.0 /100 | #304 | Tragic 2.8% |
Demographics Similar to Salvadorans by Self-Care Disability
In terms of self-care disability, the demographic groups most similar to Salvadorans are Yugoslavian (2.5%, a difference of 0.020%), Maltese (2.5%, a difference of 0.050%), Slavic (2.5%, a difference of 0.11%), Immigrants from El Salvador (2.5%, a difference of 0.18%), and Ghanaian (2.5%, a difference of 0.20%).
| Demographics | Rating | Rank | Self-Care Disability |
| Immigrants | Afghanistan | 47.6 /100 | #176 | Average 2.5% |
| Immigrants | Kazakhstan | 46.7 /100 | #177 | Average 2.5% |
| English | 46.2 /100 | #178 | Average 2.5% |
| Hungarians | 45.5 /100 | #179 | Average 2.5% |
| Indonesians | 41.2 /100 | #180 | Average 2.5% |
| Ghanaians | 40.4 /100 | #181 | Average 2.5% |
| Maltese | 37.5 /100 | #182 | Fair 2.5% |
| Salvadorans | 36.4 /100 | #183 | Fair 2.5% |
| Yugoslavians | 36.1 /100 | #184 | Fair 2.5% |
| Slavs | 34.3 /100 | #185 | Fair 2.5% |
| Immigrants | El Salvador | 33.0 /100 | #186 | Fair 2.5% |
| Irish | 28.7 /100 | #187 | Fair 2.5% |
| Immigrants | Oceania | 28.3 /100 | #188 | Fair 2.5% |
| Immigrants | Eastern Europe | 28.0 /100 | #189 | Fair 2.5% |
| Sioux | 24.6 /100 | #190 | Fair 2.5% |