Russian vs Cheyenne Disability
COMPARE
Russian
Cheyenne
Disability
Disability Comparison
Russians
Cheyenne
11.5%
DISABILITY
86.8/ 100
METRIC RATING
140th/ 347
METRIC RANK
13.0%
DISABILITY
0.0/ 100
METRIC RATING
290th/ 347
METRIC RANK
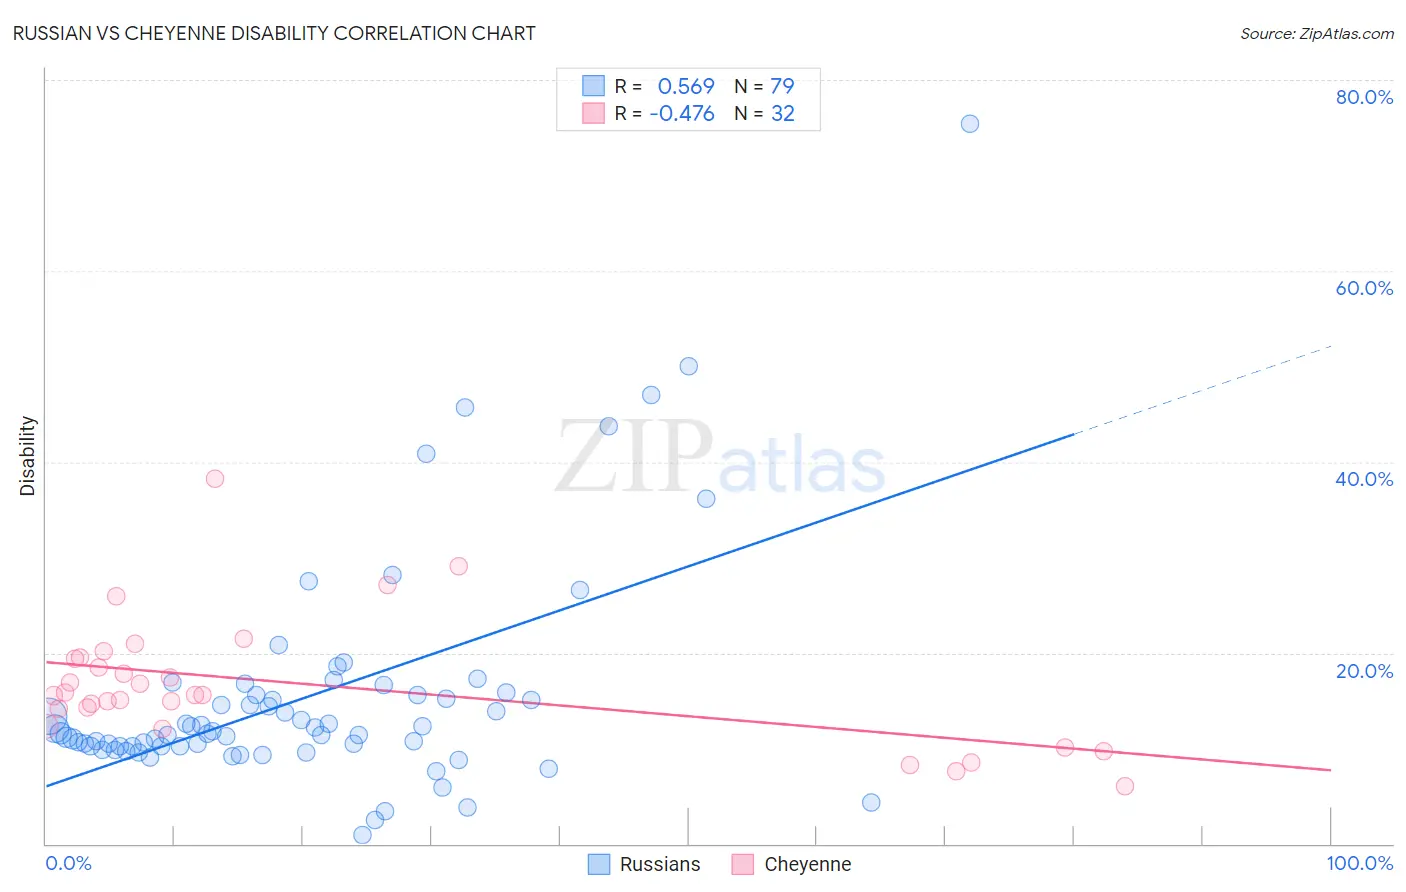
Russian vs Cheyenne Disability Correlation Chart
The statistical analysis conducted on geographies consisting of 512,171,933 people shows a substantial positive correlation between the proportion of Russians and percentage of population with a disability in the United States with a correlation coefficient (R) of 0.569 and weighted average of 11.5%. Similarly, the statistical analysis conducted on geographies consisting of 80,710,371 people shows a moderate negative correlation between the proportion of Cheyenne and percentage of population with a disability in the United States with a correlation coefficient (R) of -0.476 and weighted average of 13.0%, a difference of 13.7%.
Disability Correlation Summary
| Measurement | Russian | Cheyenne |
| Minimum | 0.92% | 6.1% |
| Maximum | 75.4% | 38.2% |
| Range | 74.5% | 32.2% |
| Mean | 15.4% | 16.7% |
| Median | 11.6% | 15.6% |
| Interquartile 25% (IQ1) | 10.2% | 13.3% |
| Interquartile 75% (IQ3) | 15.6% | 19.4% |
| Interquartile Range (IQR) | 5.4% | 6.1% |
| Standard Deviation (Sample) | 11.9% | 6.7% |
| Standard Deviation (Population) | 11.8% | 6.6% |
Similar Demographics by Disability
Demographics Similar to Russians by Disability
In terms of disability, the demographic groups most similar to Russians are New Zealander (11.5%, a difference of 0.020%), Ghanaian (11.5%, a difference of 0.020%), Kenyan (11.5%, a difference of 0.030%), Immigrants from Grenada (11.5%, a difference of 0.070%), and Immigrants from St. Vincent and the Grenadines (11.4%, a difference of 0.10%).
| Demographics | Rating | Rank | Disability |
| Arabs | 89.1 /100 | #133 | Excellent 11.4% |
| Immigrants | Guyana | 88.3 /100 | #134 | Excellent 11.4% |
| Ugandans | 87.9 /100 | #135 | Excellent 11.4% |
| Immigrants | St. Vincent and the Grenadines | 87.8 /100 | #136 | Excellent 11.4% |
| Kenyans | 87.1 /100 | #137 | Excellent 11.5% |
| New Zealanders | 87.0 /100 | #138 | Excellent 11.5% |
| Ghanaians | 87.0 /100 | #139 | Excellent 11.5% |
| Russians | 86.8 /100 | #140 | Excellent 11.5% |
| Immigrants | Grenada | 86.1 /100 | #141 | Excellent 11.5% |
| Immigrants | Sudan | 85.3 /100 | #142 | Excellent 11.5% |
| Moroccans | 83.3 /100 | #143 | Excellent 11.5% |
| Australians | 82.5 /100 | #144 | Excellent 11.5% |
| Nigerians | 81.3 /100 | #145 | Excellent 11.5% |
| Immigrants | Hungary | 79.0 /100 | #146 | Good 11.5% |
| Immigrants | Ukraine | 77.6 /100 | #147 | Good 11.5% |
Demographics Similar to Cheyenne by Disability
In terms of disability, the demographic groups most similar to Cheyenne are White/Caucasian (13.0%, a difference of 0.060%), Slovak (13.0%, a difference of 0.060%), African (13.0%, a difference of 0.080%), Yaqui (13.1%, a difference of 0.23%), and English (13.0%, a difference of 0.49%).
| Demographics | Rating | Rank | Disability |
| Irish | 0.0 /100 | #283 | Tragic 12.9% |
| Welsh | 0.0 /100 | #284 | Tragic 12.9% |
| Crow | 0.0 /100 | #285 | Tragic 12.9% |
| English | 0.0 /100 | #286 | Tragic 13.0% |
| Africans | 0.0 /100 | #287 | Tragic 13.0% |
| Whites/Caucasians | 0.0 /100 | #288 | Tragic 13.0% |
| Slovaks | 0.0 /100 | #289 | Tragic 13.0% |
| Cheyenne | 0.0 /100 | #290 | Tragic 13.0% |
| Yaqui | 0.0 /100 | #291 | Tragic 13.1% |
| Aleuts | 0.0 /100 | #292 | Tragic 13.1% |
| Marshallese | 0.0 /100 | #293 | Tragic 13.1% |
| Celtics | 0.0 /100 | #294 | Tragic 13.1% |
| Immigrants | Nonimmigrants | 0.0 /100 | #295 | Tragic 13.2% |
| Central American Indians | 0.0 /100 | #296 | Tragic 13.2% |
| Hopi | 0.0 /100 | #297 | Tragic 13.2% |