Russian vs Cheyenne Associate's Degree
COMPARE
Russian
Cheyenne
Associate's Degree
Associate's Degree Comparison
Russians
Cheyenne
53.2%
ASSOCIATE'S DEGREE
100.0/ 100
METRIC RATING
35th/ 347
METRIC RANK
38.7%
ASSOCIATE'S DEGREE
0.0/ 100
METRIC RATING
298th/ 347
METRIC RANK
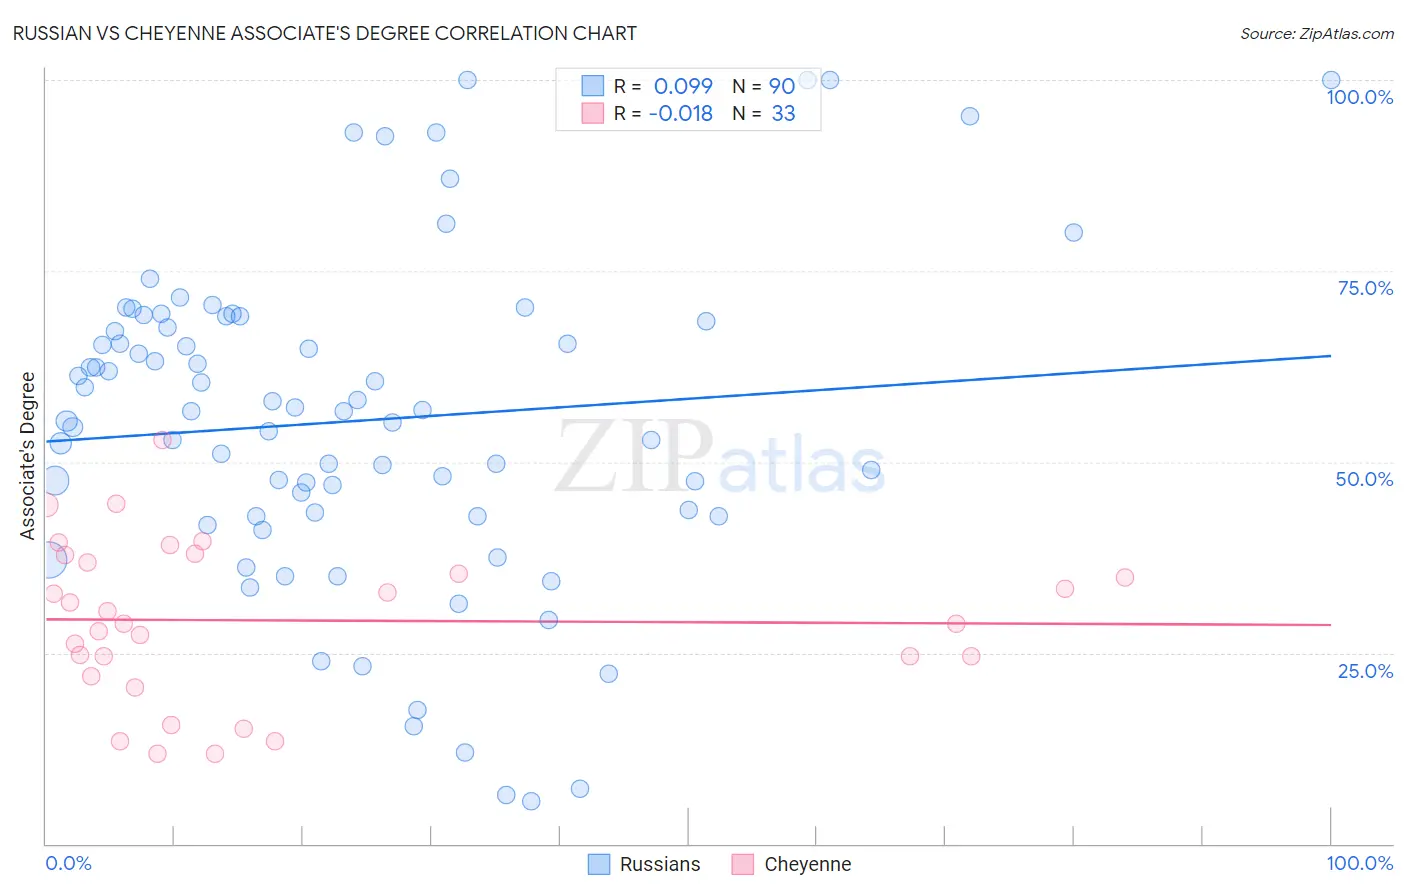
Russian vs Cheyenne Associate's Degree Correlation Chart
The statistical analysis conducted on geographies consisting of 512,209,602 people shows a slight positive correlation between the proportion of Russians and percentage of population with at least associate's degree education in the United States with a correlation coefficient (R) of 0.099 and weighted average of 53.2%. Similarly, the statistical analysis conducted on geographies consisting of 80,719,085 people shows no correlation between the proportion of Cheyenne and percentage of population with at least associate's degree education in the United States with a correlation coefficient (R) of -0.018 and weighted average of 38.7%, a difference of 37.7%.
Associate's Degree Correlation Summary
| Measurement | Russian | Cheyenne |
| Minimum | 5.6% | 11.8% |
| Maximum | 100.0% | 52.8% |
| Range | 94.4% | 41.1% |
| Mean | 55.4% | 29.2% |
| Median | 56.6% | 28.8% |
| Interquartile 25% (IQ1) | 42.9% | 23.2% |
| Interquartile 75% (IQ3) | 68.4% | 37.3% |
| Interquartile Range (IQR) | 25.5% | 14.1% |
| Standard Deviation (Sample) | 21.5% | 10.3% |
| Standard Deviation (Population) | 21.3% | 10.1% |
Similar Demographics by Associate's Degree
Demographics Similar to Russians by Associate's Degree
In terms of associate's degree, the demographic groups most similar to Russians are Bulgarian (53.3%, a difference of 0.060%), Israeli (53.4%, a difference of 0.26%), Immigrants from Russia (53.1%, a difference of 0.28%), Immigrants from Denmark (53.1%, a difference of 0.36%), and Immigrants from Turkey (53.4%, a difference of 0.38%).
| Demographics | Rating | Rank | Associate's Degree |
| Turks | 100.0 /100 | #28 | Exceptional 53.9% |
| Immigrants | France | 100.0 /100 | #29 | Exceptional 53.9% |
| Immigrants | Sri Lanka | 100.0 /100 | #30 | Exceptional 53.7% |
| Immigrants | Northern Europe | 100.0 /100 | #31 | Exceptional 53.5% |
| Immigrants | Turkey | 100.0 /100 | #32 | Exceptional 53.4% |
| Israelis | 100.0 /100 | #33 | Exceptional 53.4% |
| Bulgarians | 100.0 /100 | #34 | Exceptional 53.3% |
| Russians | 100.0 /100 | #35 | Exceptional 53.2% |
| Immigrants | Russia | 100.0 /100 | #36 | Exceptional 53.1% |
| Immigrants | Denmark | 100.0 /100 | #37 | Exceptional 53.1% |
| Mongolians | 100.0 /100 | #38 | Exceptional 53.0% |
| Immigrants | Belarus | 99.9 /100 | #39 | Exceptional 52.8% |
| Immigrants | Latvia | 99.9 /100 | #40 | Exceptional 52.8% |
| Immigrants | Saudi Arabia | 99.9 /100 | #41 | Exceptional 52.6% |
| Immigrants | Malaysia | 99.9 /100 | #42 | Exceptional 52.5% |
Demographics Similar to Cheyenne by Associate's Degree
In terms of associate's degree, the demographic groups most similar to Cheyenne are Ute (38.6%, a difference of 0.090%), Chickasaw (38.6%, a difference of 0.13%), Tsimshian (38.6%, a difference of 0.19%), Cape Verdean (38.8%, a difference of 0.26%), and Colville (38.5%, a difference of 0.34%).
| Demographics | Rating | Rank | Associate's Degree |
| Dominicans | 0.0 /100 | #291 | Tragic 39.3% |
| Blacks/African Americans | 0.0 /100 | #292 | Tragic 39.1% |
| Nepalese | 0.0 /100 | #293 | Tragic 39.0% |
| Salvadorans | 0.0 /100 | #294 | Tragic 39.0% |
| Hondurans | 0.0 /100 | #295 | Tragic 38.9% |
| Cherokee | 0.0 /100 | #296 | Tragic 38.9% |
| Cape Verdeans | 0.0 /100 | #297 | Tragic 38.8% |
| Cheyenne | 0.0 /100 | #298 | Tragic 38.7% |
| Ute | 0.0 /100 | #299 | Tragic 38.6% |
| Chickasaw | 0.0 /100 | #300 | Tragic 38.6% |
| Tsimshian | 0.0 /100 | #301 | Tragic 38.6% |
| Colville | 0.0 /100 | #302 | Tragic 38.5% |
| Guatemalans | 0.0 /100 | #303 | Tragic 38.5% |
| Sioux | 0.0 /100 | #304 | Tragic 38.5% |
| Immigrants | Honduras | 0.0 /100 | #305 | Tragic 38.5% |