Russian vs Immigrants from Albania Disability
COMPARE
Russian
Immigrants from Albania
Disability
Disability Comparison
Russians
Immigrants from Albania
11.5%
DISABILITY
86.8/ 100
METRIC RATING
140th/ 347
METRIC RANK
11.7%
DISABILITY
52.8/ 100
METRIC RATING
170th/ 347
METRIC RANK
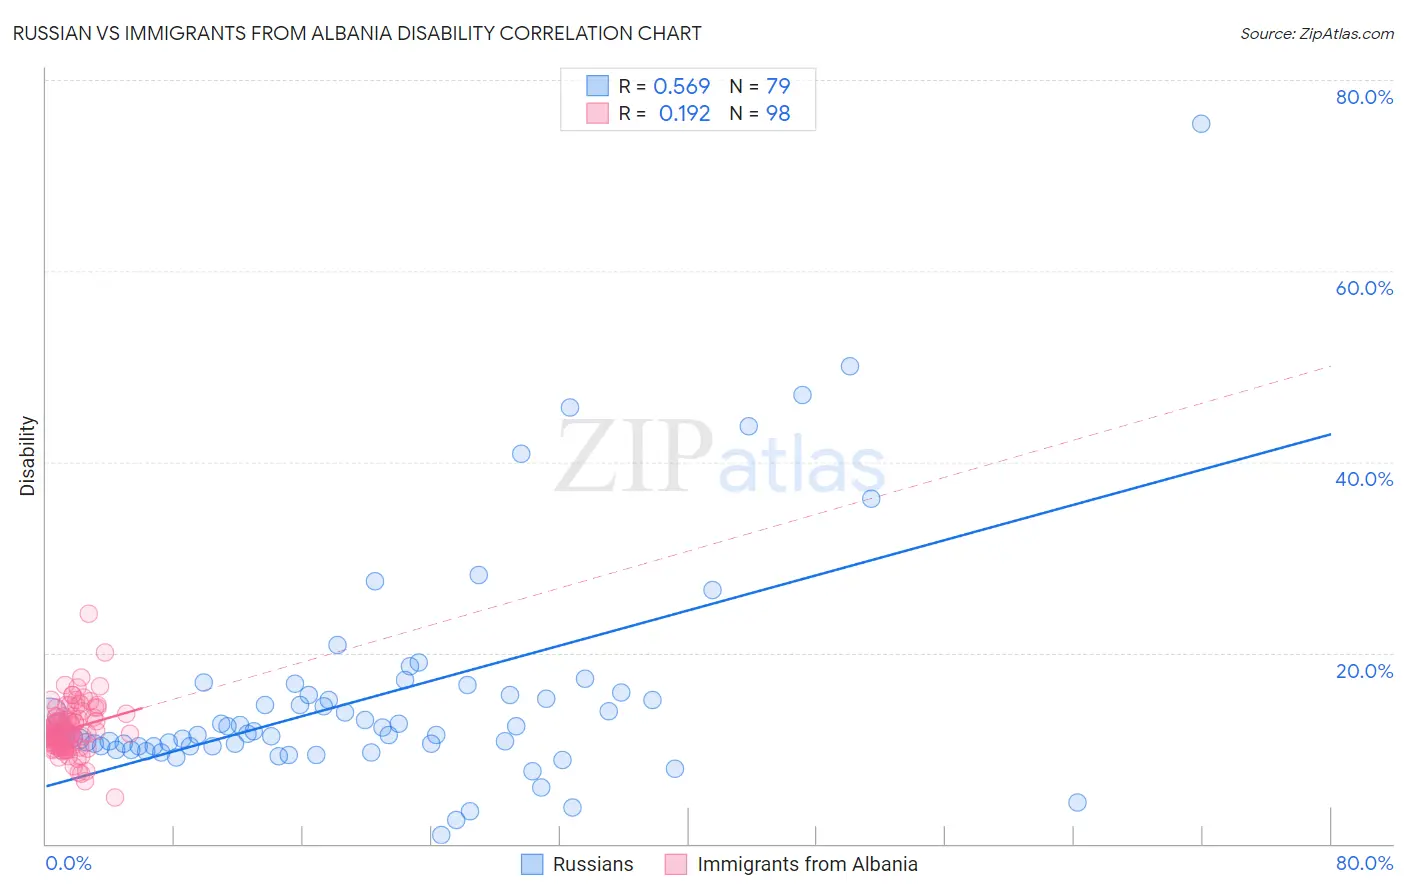
Russian vs Immigrants from Albania Disability Correlation Chart
The statistical analysis conducted on geographies consisting of 512,171,933 people shows a substantial positive correlation between the proportion of Russians and percentage of population with a disability in the United States with a correlation coefficient (R) of 0.569 and weighted average of 11.5%. Similarly, the statistical analysis conducted on geographies consisting of 119,399,287 people shows a poor positive correlation between the proportion of Immigrants from Albania and percentage of population with a disability in the United States with a correlation coefficient (R) of 0.192 and weighted average of 11.7%, a difference of 2.0%.
Disability Correlation Summary
| Measurement | Russian | Immigrants from Albania |
| Minimum | 0.92% | 4.8% |
| Maximum | 75.4% | 24.1% |
| Range | 74.5% | 19.3% |
| Mean | 15.4% | 12.0% |
| Median | 11.6% | 11.6% |
| Interquartile 25% (IQ1) | 10.2% | 10.3% |
| Interquartile 75% (IQ3) | 15.6% | 13.3% |
| Interquartile Range (IQR) | 5.4% | 3.0% |
| Standard Deviation (Sample) | 11.9% | 2.7% |
| Standard Deviation (Population) | 11.8% | 2.7% |
Similar Demographics by Disability
Demographics Similar to Russians by Disability
In terms of disability, the demographic groups most similar to Russians are New Zealander (11.5%, a difference of 0.020%), Ghanaian (11.5%, a difference of 0.020%), Kenyan (11.5%, a difference of 0.030%), Immigrants from Grenada (11.5%, a difference of 0.070%), and Immigrants from St. Vincent and the Grenadines (11.4%, a difference of 0.10%).
| Demographics | Rating | Rank | Disability |
| Arabs | 89.1 /100 | #133 | Excellent 11.4% |
| Immigrants | Guyana | 88.3 /100 | #134 | Excellent 11.4% |
| Ugandans | 87.9 /100 | #135 | Excellent 11.4% |
| Immigrants | St. Vincent and the Grenadines | 87.8 /100 | #136 | Excellent 11.4% |
| Kenyans | 87.1 /100 | #137 | Excellent 11.5% |
| New Zealanders | 87.0 /100 | #138 | Excellent 11.5% |
| Ghanaians | 87.0 /100 | #139 | Excellent 11.5% |
| Russians | 86.8 /100 | #140 | Excellent 11.5% |
| Immigrants | Grenada | 86.1 /100 | #141 | Excellent 11.5% |
| Immigrants | Sudan | 85.3 /100 | #142 | Excellent 11.5% |
| Moroccans | 83.3 /100 | #143 | Excellent 11.5% |
| Australians | 82.5 /100 | #144 | Excellent 11.5% |
| Nigerians | 81.3 /100 | #145 | Excellent 11.5% |
| Immigrants | Hungary | 79.0 /100 | #146 | Good 11.5% |
| Immigrants | Ukraine | 77.6 /100 | #147 | Good 11.5% |
Demographics Similar to Immigrants from Albania by Disability
In terms of disability, the demographic groups most similar to Immigrants from Albania are Immigrants from Southern Europe (11.7%, a difference of 0.0%), Trinidadian and Tobagonian (11.7%, a difference of 0.010%), Immigrants from Austria (11.7%, a difference of 0.030%), Immigrants from Latin America (11.7%, a difference of 0.060%), and Estonian (11.7%, a difference of 0.070%).
| Demographics | Rating | Rank | Disability |
| Immigrants | Trinidad and Tobago | 58.9 /100 | #163 | Average 11.7% |
| Syrians | 58.5 /100 | #164 | Average 11.7% |
| Cubans | 56.7 /100 | #165 | Average 11.7% |
| Pakistanis | 54.7 /100 | #166 | Average 11.7% |
| Estonians | 54.4 /100 | #167 | Average 11.7% |
| Immigrants | Latin America | 54.1 /100 | #168 | Average 11.7% |
| Immigrants | Austria | 53.4 /100 | #169 | Average 11.7% |
| Immigrants | Albania | 52.8 /100 | #170 | Average 11.7% |
| Immigrants | Southern Europe | 52.8 /100 | #171 | Average 11.7% |
| Trinidadians and Tobagonians | 52.7 /100 | #172 | Average 11.7% |
| Maltese | 50.6 /100 | #173 | Average 11.7% |
| Albanians | 50.0 /100 | #174 | Average 11.7% |
| Haitians | 48.6 /100 | #175 | Average 11.7% |
| Immigrants | Western Africa | 47.5 /100 | #176 | Average 11.7% |
| Immigrants | Central America | 46.6 /100 | #177 | Average 11.7% |