Russian vs Immigrants from Northern Africa Disability
COMPARE
Russian
Immigrants from Northern Africa
Disability
Disability Comparison
Russians
Immigrants from Northern Africa
11.5%
DISABILITY
86.8/ 100
METRIC RATING
140th/ 347
METRIC RANK
10.9%
DISABILITY
99.7/ 100
METRIC RATING
62nd/ 347
METRIC RANK
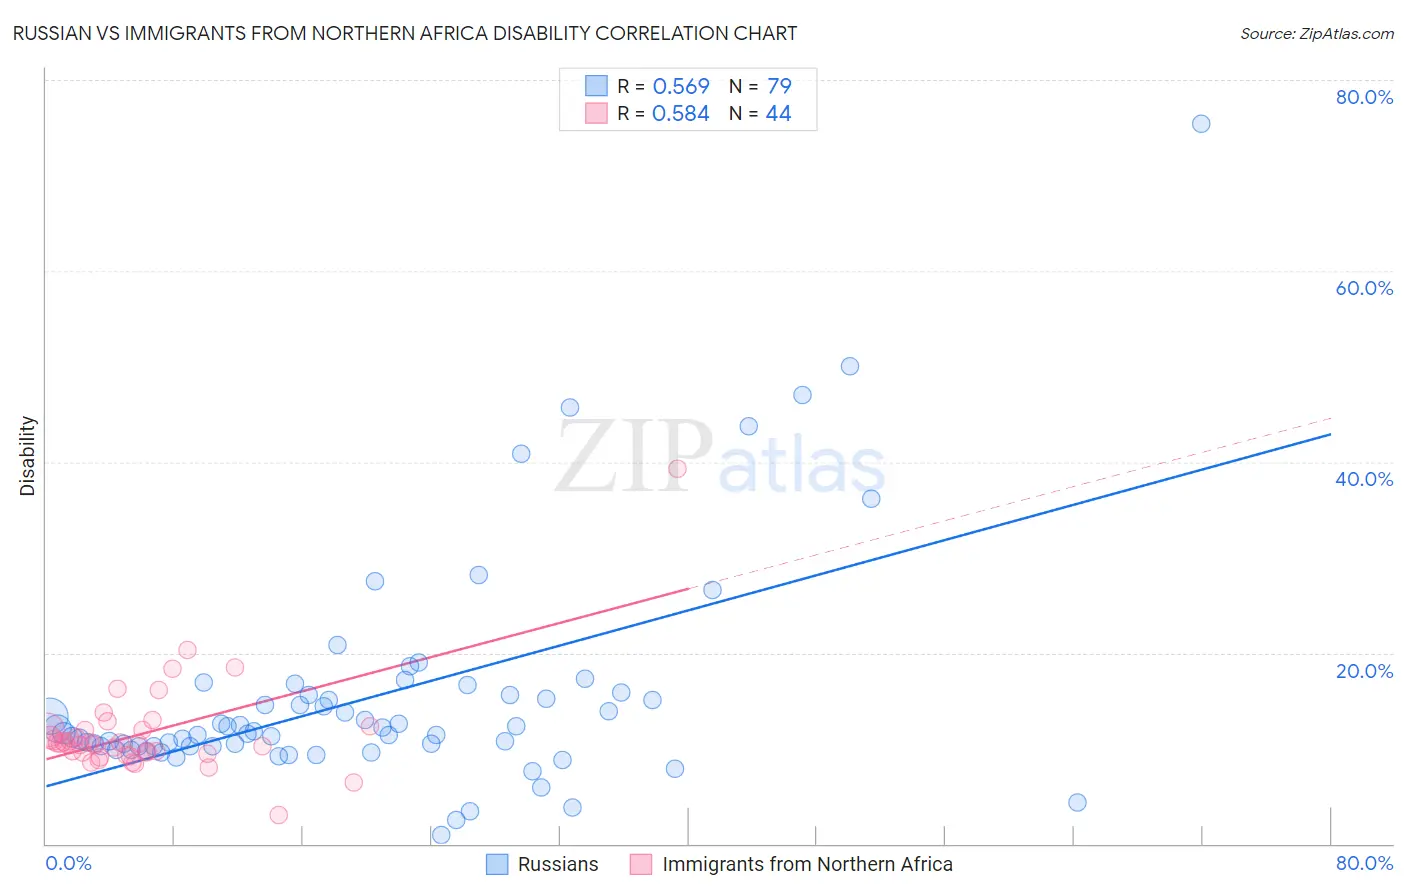
Russian vs Immigrants from Northern Africa Disability Correlation Chart
The statistical analysis conducted on geographies consisting of 512,171,933 people shows a substantial positive correlation between the proportion of Russians and percentage of population with a disability in the United States with a correlation coefficient (R) of 0.569 and weighted average of 11.5%. Similarly, the statistical analysis conducted on geographies consisting of 321,190,304 people shows a substantial positive correlation between the proportion of Immigrants from Northern Africa and percentage of population with a disability in the United States with a correlation coefficient (R) of 0.584 and weighted average of 10.9%, a difference of 4.6%.
Disability Correlation Summary
| Measurement | Russian | Immigrants from Northern Africa |
| Minimum | 0.92% | 3.0% |
| Maximum | 75.4% | 39.3% |
| Range | 74.5% | 36.3% |
| Mean | 15.4% | 11.6% |
| Median | 11.6% | 10.5% |
| Interquartile 25% (IQ1) | 10.2% | 9.4% |
| Interquartile 75% (IQ3) | 15.6% | 11.9% |
| Interquartile Range (IQR) | 5.4% | 2.5% |
| Standard Deviation (Sample) | 11.9% | 5.3% |
| Standard Deviation (Population) | 11.8% | 5.2% |
Similar Demographics by Disability
Demographics Similar to Russians by Disability
In terms of disability, the demographic groups most similar to Russians are New Zealander (11.5%, a difference of 0.020%), Ghanaian (11.5%, a difference of 0.020%), Kenyan (11.5%, a difference of 0.030%), Immigrants from Grenada (11.5%, a difference of 0.070%), and Immigrants from St. Vincent and the Grenadines (11.4%, a difference of 0.10%).
| Demographics | Rating | Rank | Disability |
| Arabs | 89.1 /100 | #133 | Excellent 11.4% |
| Immigrants | Guyana | 88.3 /100 | #134 | Excellent 11.4% |
| Ugandans | 87.9 /100 | #135 | Excellent 11.4% |
| Immigrants | St. Vincent and the Grenadines | 87.8 /100 | #136 | Excellent 11.4% |
| Kenyans | 87.1 /100 | #137 | Excellent 11.5% |
| New Zealanders | 87.0 /100 | #138 | Excellent 11.5% |
| Ghanaians | 87.0 /100 | #139 | Excellent 11.5% |
| Russians | 86.8 /100 | #140 | Excellent 11.5% |
| Immigrants | Grenada | 86.1 /100 | #141 | Excellent 11.5% |
| Immigrants | Sudan | 85.3 /100 | #142 | Excellent 11.5% |
| Moroccans | 83.3 /100 | #143 | Excellent 11.5% |
| Australians | 82.5 /100 | #144 | Excellent 11.5% |
| Nigerians | 81.3 /100 | #145 | Excellent 11.5% |
| Immigrants | Hungary | 79.0 /100 | #146 | Good 11.5% |
| Immigrants | Ukraine | 77.6 /100 | #147 | Good 11.5% |
Demographics Similar to Immigrants from Northern Africa by Disability
In terms of disability, the demographic groups most similar to Immigrants from Northern Africa are Immigrants from Eritrea (11.0%, a difference of 0.020%), Immigrants from Bulgaria (10.9%, a difference of 0.040%), Zimbabwean (10.9%, a difference of 0.10%), Immigrants from Colombia (10.9%, a difference of 0.19%), and Immigrants from Sweden (11.0%, a difference of 0.20%).
| Demographics | Rating | Rank | Disability |
| Immigrants | El Salvador | 99.8 /100 | #55 | Exceptional 10.9% |
| Immigrants | Lithuania | 99.8 /100 | #56 | Exceptional 10.9% |
| Salvadorans | 99.8 /100 | #57 | Exceptional 10.9% |
| Immigrants | South America | 99.8 /100 | #58 | Exceptional 10.9% |
| Immigrants | Colombia | 99.7 /100 | #59 | Exceptional 10.9% |
| Zimbabweans | 99.7 /100 | #60 | Exceptional 10.9% |
| Immigrants | Bulgaria | 99.7 /100 | #61 | Exceptional 10.9% |
| Immigrants | Northern Africa | 99.7 /100 | #62 | Exceptional 10.9% |
| Immigrants | Eritrea | 99.7 /100 | #63 | Exceptional 11.0% |
| Immigrants | Sweden | 99.6 /100 | #64 | Exceptional 11.0% |
| Bulgarians | 99.6 /100 | #65 | Exceptional 11.0% |
| Laotians | 99.6 /100 | #66 | Exceptional 11.0% |
| Colombians | 99.6 /100 | #67 | Exceptional 11.0% |
| Immigrants | Afghanistan | 99.6 /100 | #68 | Exceptional 11.0% |
| Sri Lankans | 99.5 /100 | #69 | Exceptional 11.0% |