Russian vs Houma Disability
COMPARE
Russian
Houma
Disability
Disability Comparison
Russians
Houma
11.5%
DISABILITY
86.8/ 100
METRIC RATING
140th/ 347
METRIC RANK
17.1%
DISABILITY
0.0/ 100
METRIC RATING
347th/ 347
METRIC RANK
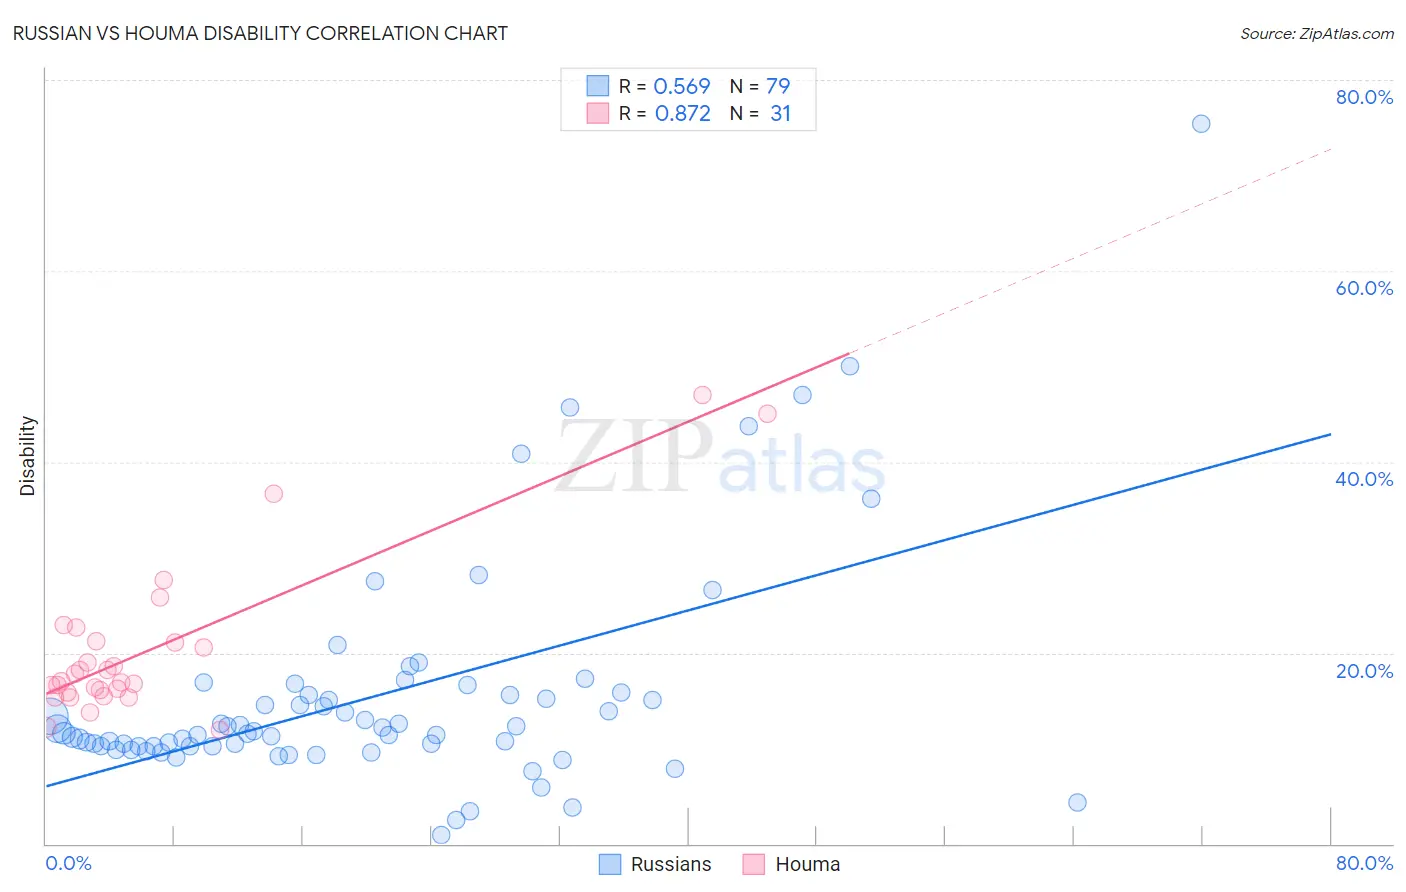
Russian vs Houma Disability Correlation Chart
The statistical analysis conducted on geographies consisting of 512,171,933 people shows a substantial positive correlation between the proportion of Russians and percentage of population with a disability in the United States with a correlation coefficient (R) of 0.569 and weighted average of 11.5%. Similarly, the statistical analysis conducted on geographies consisting of 36,799,095 people shows a very strong positive correlation between the proportion of Houma and percentage of population with a disability in the United States with a correlation coefficient (R) of 0.872 and weighted average of 17.1%, a difference of 49.7%.
Disability Correlation Summary
| Measurement | Russian | Houma |
| Minimum | 0.92% | 11.9% |
| Maximum | 75.4% | 47.0% |
| Range | 74.5% | 35.2% |
| Mean | 15.4% | 20.3% |
| Median | 11.6% | 17.0% |
| Interquartile 25% (IQ1) | 10.2% | 15.9% |
| Interquartile 75% (IQ3) | 15.6% | 21.2% |
| Interquartile Range (IQR) | 5.4% | 5.3% |
| Standard Deviation (Sample) | 11.9% | 8.4% |
| Standard Deviation (Population) | 11.8% | 8.3% |
Similar Demographics by Disability
Demographics Similar to Russians by Disability
In terms of disability, the demographic groups most similar to Russians are New Zealander (11.5%, a difference of 0.020%), Ghanaian (11.5%, a difference of 0.020%), Kenyan (11.5%, a difference of 0.030%), Immigrants from Grenada (11.5%, a difference of 0.070%), and Immigrants from St. Vincent and the Grenadines (11.4%, a difference of 0.10%).
| Demographics | Rating | Rank | Disability |
| Arabs | 89.1 /100 | #133 | Excellent 11.4% |
| Immigrants | Guyana | 88.3 /100 | #134 | Excellent 11.4% |
| Ugandans | 87.9 /100 | #135 | Excellent 11.4% |
| Immigrants | St. Vincent and the Grenadines | 87.8 /100 | #136 | Excellent 11.4% |
| Kenyans | 87.1 /100 | #137 | Excellent 11.5% |
| New Zealanders | 87.0 /100 | #138 | Excellent 11.5% |
| Ghanaians | 87.0 /100 | #139 | Excellent 11.5% |
| Russians | 86.8 /100 | #140 | Excellent 11.5% |
| Immigrants | Grenada | 86.1 /100 | #141 | Excellent 11.5% |
| Immigrants | Sudan | 85.3 /100 | #142 | Excellent 11.5% |
| Moroccans | 83.3 /100 | #143 | Excellent 11.5% |
| Australians | 82.5 /100 | #144 | Excellent 11.5% |
| Nigerians | 81.3 /100 | #145 | Excellent 11.5% |
| Immigrants | Hungary | 79.0 /100 | #146 | Good 11.5% |
| Immigrants | Ukraine | 77.6 /100 | #147 | Good 11.5% |
Demographics Similar to Houma by Disability
In terms of disability, the demographic groups most similar to Houma are Tsimshian (16.1%, a difference of 6.2%), Puerto Rican (16.1%, a difference of 6.4%), Colville (15.8%, a difference of 8.6%), Creek (15.6%, a difference of 9.9%), and Kiowa (15.6%, a difference of 9.9%).
| Demographics | Rating | Rank | Disability |
| Cajuns | 0.0 /100 | #333 | Tragic 14.6% |
| Yuman | 0.0 /100 | #334 | Tragic 14.6% |
| Tohono O'odham | 0.0 /100 | #335 | Tragic 14.8% |
| Cherokee | 0.0 /100 | #336 | Tragic 14.8% |
| Seminole | 0.0 /100 | #337 | Tragic 14.9% |
| Dutch West Indians | 0.0 /100 | #338 | Tragic 14.9% |
| Chickasaw | 0.0 /100 | #339 | Tragic 15.2% |
| Choctaw | 0.0 /100 | #340 | Tragic 15.4% |
| Lumbee | 0.0 /100 | #341 | Tragic 15.5% |
| Kiowa | 0.0 /100 | #342 | Tragic 15.6% |
| Creek | 0.0 /100 | #343 | Tragic 15.6% |
| Colville | 0.0 /100 | #344 | Tragic 15.8% |
| Puerto Ricans | 0.0 /100 | #345 | Tragic 16.1% |
| Tsimshian | 0.0 /100 | #346 | Tragic 16.1% |
| Houma | 0.0 /100 | #347 | Tragic 17.1% |