Russian vs Cheyenne In Labor Force | Age 25-29
COMPARE
Russian
Cheyenne
In Labor Force | Age 25-29
In Labor Force | Age 25-29 Comparison
Russians
Cheyenne
85.3%
IN LABOR FORCE | AGE 25-29
98.8/ 100
METRIC RATING
73rd/ 347
METRIC RANK
80.3%
IN LABOR FORCE | AGE 25-29
0.0/ 100
METRIC RATING
331st/ 347
METRIC RANK
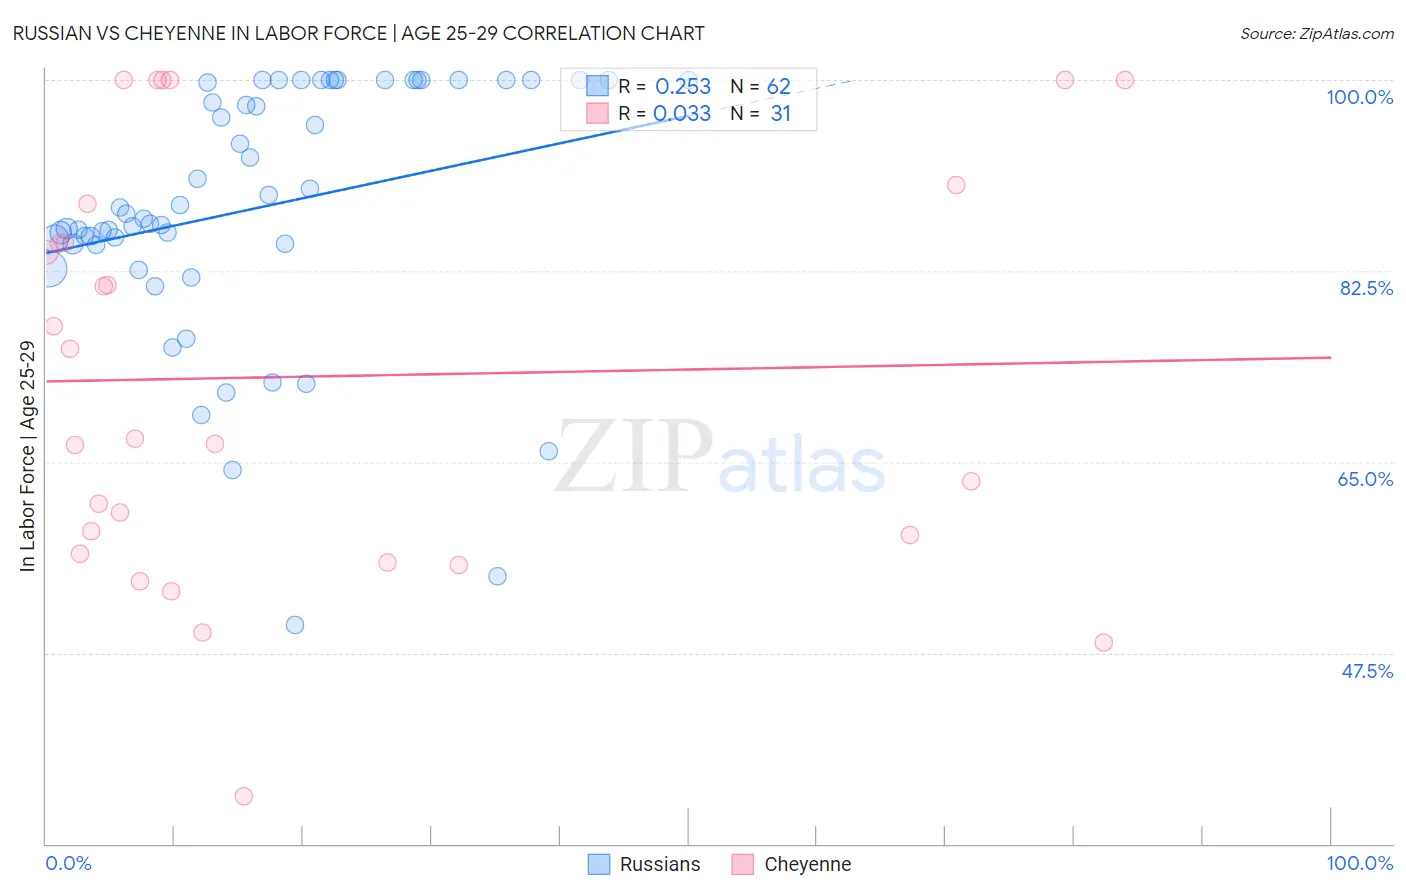
Russian vs Cheyenne In Labor Force | Age 25-29 Correlation Chart
The statistical analysis conducted on geographies consisting of 511,687,113 people shows a weak positive correlation between the proportion of Russians and labor force participation rate among population between the ages 25 and 29 in the United States with a correlation coefficient (R) of 0.253 and weighted average of 85.3%. Similarly, the statistical analysis conducted on geographies consisting of 80,678,314 people shows no correlation between the proportion of Cheyenne and labor force participation rate among population between the ages 25 and 29 in the United States with a correlation coefficient (R) of 0.033 and weighted average of 80.3%, a difference of 6.3%.
In Labor Force | Age 25-29 Correlation Summary
| Measurement | Russian | Cheyenne |
| Minimum | 50.0% | 34.3% |
| Maximum | 100.0% | 100.0% |
| Range | 50.0% | 65.7% |
| Mean | 88.2% | 72.8% |
| Median | 87.5% | 67.1% |
| Interquartile 25% (IQ1) | 85.0% | 56.6% |
| Interquartile 75% (IQ3) | 100.0% | 88.6% |
| Interquartile Range (IQR) | 15.0% | 32.0% |
| Standard Deviation (Sample) | 11.7% | 18.9% |
| Standard Deviation (Population) | 11.6% | 18.6% |
Similar Demographics by In Labor Force | Age 25-29
Demographics Similar to Russians by In Labor Force | Age 25-29
In terms of in labor force | age 25-29, the demographic groups most similar to Russians are Immigrants from Australia (85.3%, a difference of 0.010%), Kenyan (85.4%, a difference of 0.030%), Immigrants from Sweden (85.4%, a difference of 0.040%), Soviet Union (85.3%, a difference of 0.040%), and Menominee (85.4%, a difference of 0.050%).
| Demographics | Rating | Rank | In Labor Force | Age 25-29 |
| Immigrants | Scotland | 99.3 /100 | #66 | Exceptional 85.4% |
| Immigrants | Turkey | 99.2 /100 | #67 | Exceptional 85.4% |
| Immigrants | Cameroon | 99.2 /100 | #68 | Exceptional 85.4% |
| Menominee | 99.1 /100 | #69 | Exceptional 85.4% |
| Immigrants | Sweden | 99.1 /100 | #70 | Exceptional 85.4% |
| Kenyans | 99.0 /100 | #71 | Exceptional 85.4% |
| Immigrants | Australia | 98.9 /100 | #72 | Exceptional 85.3% |
| Russians | 98.8 /100 | #73 | Exceptional 85.3% |
| Soviet Union | 98.5 /100 | #74 | Exceptional 85.3% |
| Brazilians | 98.3 /100 | #75 | Exceptional 85.3% |
| Germans | 98.1 /100 | #76 | Exceptional 85.3% |
| Immigrants | South Central Asia | 97.9 /100 | #77 | Exceptional 85.2% |
| Immigrants | Egypt | 97.7 /100 | #78 | Exceptional 85.2% |
| Immigrants | Northern Africa | 97.6 /100 | #79 | Exceptional 85.2% |
| Immigrants | Zimbabwe | 97.6 /100 | #80 | Exceptional 85.2% |
Demographics Similar to Cheyenne by In Labor Force | Age 25-29
In terms of in labor force | age 25-29, the demographic groups most similar to Cheyenne are Puerto Rican (80.4%, a difference of 0.14%), Yakama (80.6%, a difference of 0.37%), Creek (80.7%, a difference of 0.48%), Ute (80.8%, a difference of 0.62%), and Inupiat (79.8%, a difference of 0.69%).
| Demographics | Rating | Rank | In Labor Force | Age 25-29 |
| Houma | 0.0 /100 | #324 | Tragic 81.2% |
| Dutch West Indians | 0.0 /100 | #325 | Tragic 81.1% |
| Choctaw | 0.0 /100 | #326 | Tragic 81.0% |
| Ute | 0.0 /100 | #327 | Tragic 80.8% |
| Creek | 0.0 /100 | #328 | Tragic 80.7% |
| Yakama | 0.0 /100 | #329 | Tragic 80.6% |
| Puerto Ricans | 0.0 /100 | #330 | Tragic 80.4% |
| Cheyenne | 0.0 /100 | #331 | Tragic 80.3% |
| Inupiat | 0.0 /100 | #332 | Tragic 79.8% |
| Sioux | 0.0 /100 | #333 | Tragic 79.7% |
| Yuman | 0.0 /100 | #334 | Tragic 79.3% |
| Natives/Alaskans | 0.0 /100 | #335 | Tragic 79.3% |
| Apache | 0.0 /100 | #336 | Tragic 79.2% |
| Crow | 0.0 /100 | #337 | Tragic 78.6% |
| Lumbee | 0.0 /100 | #338 | Tragic 78.3% |