Immigrants from South America vs Cheyenne Disability
COMPARE
Immigrants from South America
Cheyenne
Disability
Disability Comparison
Immigrants from South America
Cheyenne
10.9%
DISABILITY
99.8/ 100
METRIC RATING
58th/ 347
METRIC RANK
13.0%
DISABILITY
0.0/ 100
METRIC RATING
290th/ 347
METRIC RANK
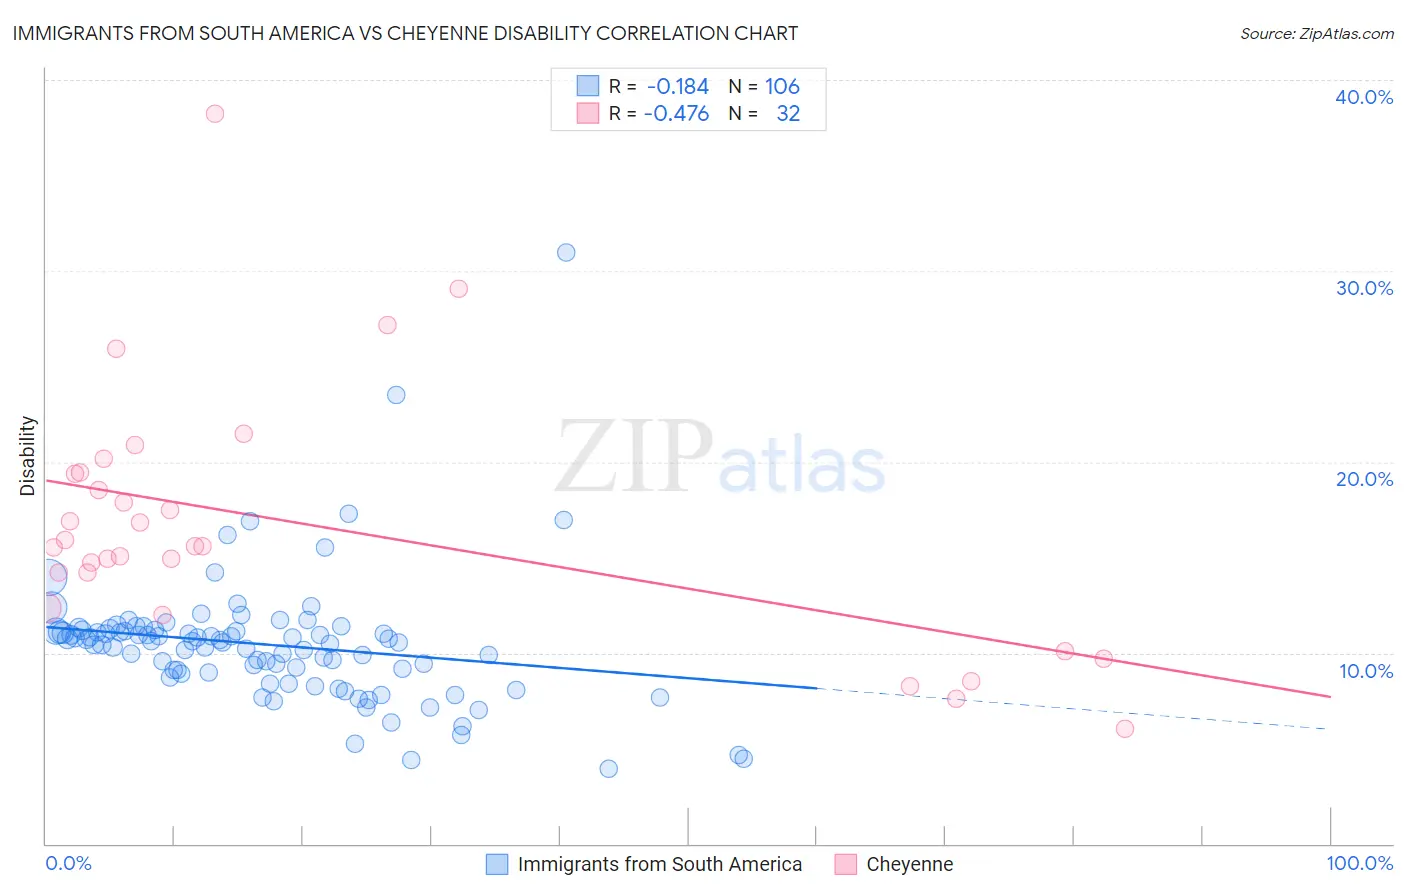
Immigrants from South America vs Cheyenne Disability Correlation Chart
The statistical analysis conducted on geographies consisting of 486,347,042 people shows a poor negative correlation between the proportion of Immigrants from South America and percentage of population with a disability in the United States with a correlation coefficient (R) of -0.184 and weighted average of 10.9%. Similarly, the statistical analysis conducted on geographies consisting of 80,710,371 people shows a moderate negative correlation between the proportion of Cheyenne and percentage of population with a disability in the United States with a correlation coefficient (R) of -0.476 and weighted average of 13.0%, a difference of 19.3%.
Disability Correlation Summary
| Measurement | Immigrants from South America | Cheyenne |
| Minimum | 3.9% | 6.1% |
| Maximum | 31.0% | 38.2% |
| Range | 27.0% | 32.2% |
| Mean | 10.4% | 16.7% |
| Median | 10.6% | 15.6% |
| Interquartile 25% (IQ1) | 9.0% | 13.3% |
| Interquartile 75% (IQ3) | 11.2% | 19.4% |
| Interquartile Range (IQR) | 2.2% | 6.1% |
| Standard Deviation (Sample) | 3.4% | 6.7% |
| Standard Deviation (Population) | 3.4% | 6.6% |
Similar Demographics by Disability
Demographics Similar to Immigrants from South America by Disability
In terms of disability, the demographic groups most similar to Immigrants from South America are Salvadoran (10.9%, a difference of 0.030%), Immigrants from Colombia (10.9%, a difference of 0.090%), Zimbabwean (10.9%, a difference of 0.18%), Immigrants from Bulgaria (10.9%, a difference of 0.24%), and Immigrants from Lithuania (10.9%, a difference of 0.27%).
| Demographics | Rating | Rank | Disability |
| Peruvians | 99.8 /100 | #51 | Exceptional 10.9% |
| South Americans | 99.8 /100 | #52 | Exceptional 10.9% |
| Immigrants | Spain | 99.8 /100 | #53 | Exceptional 10.9% |
| Jordanians | 99.8 /100 | #54 | Exceptional 10.9% |
| Immigrants | El Salvador | 99.8 /100 | #55 | Exceptional 10.9% |
| Immigrants | Lithuania | 99.8 /100 | #56 | Exceptional 10.9% |
| Salvadorans | 99.8 /100 | #57 | Exceptional 10.9% |
| Immigrants | South America | 99.8 /100 | #58 | Exceptional 10.9% |
| Immigrants | Colombia | 99.7 /100 | #59 | Exceptional 10.9% |
| Zimbabweans | 99.7 /100 | #60 | Exceptional 10.9% |
| Immigrants | Bulgaria | 99.7 /100 | #61 | Exceptional 10.9% |
| Immigrants | Northern Africa | 99.7 /100 | #62 | Exceptional 10.9% |
| Immigrants | Eritrea | 99.7 /100 | #63 | Exceptional 11.0% |
| Immigrants | Sweden | 99.6 /100 | #64 | Exceptional 11.0% |
| Bulgarians | 99.6 /100 | #65 | Exceptional 11.0% |
Demographics Similar to Cheyenne by Disability
In terms of disability, the demographic groups most similar to Cheyenne are White/Caucasian (13.0%, a difference of 0.060%), Slovak (13.0%, a difference of 0.060%), African (13.0%, a difference of 0.080%), Yaqui (13.1%, a difference of 0.23%), and English (13.0%, a difference of 0.49%).
| Demographics | Rating | Rank | Disability |
| Irish | 0.0 /100 | #283 | Tragic 12.9% |
| Welsh | 0.0 /100 | #284 | Tragic 12.9% |
| Crow | 0.0 /100 | #285 | Tragic 12.9% |
| English | 0.0 /100 | #286 | Tragic 13.0% |
| Africans | 0.0 /100 | #287 | Tragic 13.0% |
| Whites/Caucasians | 0.0 /100 | #288 | Tragic 13.0% |
| Slovaks | 0.0 /100 | #289 | Tragic 13.0% |
| Cheyenne | 0.0 /100 | #290 | Tragic 13.0% |
| Yaqui | 0.0 /100 | #291 | Tragic 13.1% |
| Aleuts | 0.0 /100 | #292 | Tragic 13.1% |
| Marshallese | 0.0 /100 | #293 | Tragic 13.1% |
| Celtics | 0.0 /100 | #294 | Tragic 13.1% |
| Immigrants | Nonimmigrants | 0.0 /100 | #295 | Tragic 13.2% |
| Central American Indians | 0.0 /100 | #296 | Tragic 13.2% |
| Hopi | 0.0 /100 | #297 | Tragic 13.2% |