Cambodian vs Cheyenne Disability
COMPARE
Cambodian
Cheyenne
Disability
Disability Comparison
Cambodians
Cheyenne
10.8%
DISABILITY
99.9/ 100
METRIC RATING
39th/ 347
METRIC RANK
13.0%
DISABILITY
0.0/ 100
METRIC RATING
290th/ 347
METRIC RANK
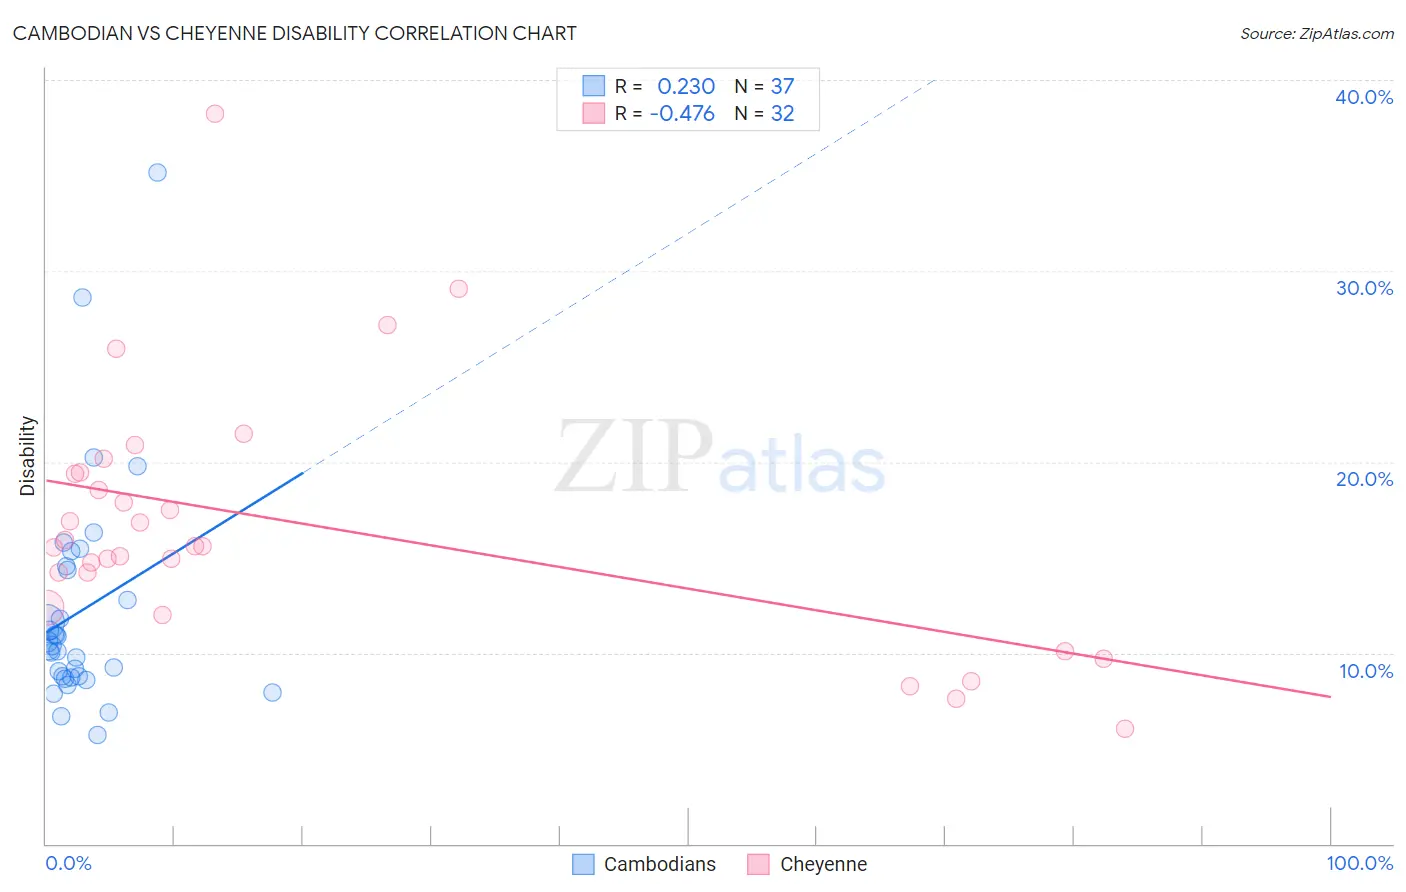
Cambodian vs Cheyenne Disability Correlation Chart
The statistical analysis conducted on geographies consisting of 102,516,949 people shows a weak positive correlation between the proportion of Cambodians and percentage of population with a disability in the United States with a correlation coefficient (R) of 0.230 and weighted average of 10.8%. Similarly, the statistical analysis conducted on geographies consisting of 80,710,371 people shows a moderate negative correlation between the proportion of Cheyenne and percentage of population with a disability in the United States with a correlation coefficient (R) of -0.476 and weighted average of 13.0%, a difference of 20.9%.
Disability Correlation Summary
| Measurement | Cambodian | Cheyenne |
| Minimum | 5.7% | 6.1% |
| Maximum | 35.1% | 38.2% |
| Range | 29.4% | 32.2% |
| Mean | 12.2% | 16.7% |
| Median | 10.4% | 15.6% |
| Interquartile 25% (IQ1) | 8.7% | 13.3% |
| Interquartile 75% (IQ3) | 14.4% | 19.4% |
| Interquartile Range (IQR) | 5.7% | 6.1% |
| Standard Deviation (Sample) | 5.9% | 6.7% |
| Standard Deviation (Population) | 5.8% | 6.6% |
Similar Demographics by Disability
Demographics Similar to Cambodians by Disability
In terms of disability, the demographic groups most similar to Cambodians are Mongolian (10.8%, a difference of 0.0%), Immigrants from Australia (10.8%, a difference of 0.040%), Afghan (10.8%, a difference of 0.10%), Immigrants from Nepal (10.8%, a difference of 0.14%), and Israeli (10.8%, a difference of 0.19%).
| Demographics | Rating | Rank | Disability |
| Paraguayans | 100.0 /100 | #32 | Exceptional 10.6% |
| Immigrants | Kuwait | 100.0 /100 | #33 | Exceptional 10.7% |
| Immigrants | Ethiopia | 100.0 /100 | #34 | Exceptional 10.7% |
| Immigrants | Indonesia | 100.0 /100 | #35 | Exceptional 10.7% |
| Ethiopians | 100.0 /100 | #36 | Exceptional 10.7% |
| Turks | 100.0 /100 | #37 | Exceptional 10.7% |
| Afghans | 99.9 /100 | #38 | Exceptional 10.8% |
| Cambodians | 99.9 /100 | #39 | Exceptional 10.8% |
| Mongolians | 99.9 /100 | #40 | Exceptional 10.8% |
| Immigrants | Australia | 99.9 /100 | #41 | Exceptional 10.8% |
| Immigrants | Nepal | 99.9 /100 | #42 | Exceptional 10.8% |
| Israelis | 99.9 /100 | #43 | Exceptional 10.8% |
| Immigrants | Japan | 99.9 /100 | #44 | Exceptional 10.8% |
| Immigrants | Peru | 99.9 /100 | #45 | Exceptional 10.8% |
| Tongans | 99.9 /100 | #46 | Exceptional 10.8% |
Demographics Similar to Cheyenne by Disability
In terms of disability, the demographic groups most similar to Cheyenne are White/Caucasian (13.0%, a difference of 0.060%), Slovak (13.0%, a difference of 0.060%), African (13.0%, a difference of 0.080%), Yaqui (13.1%, a difference of 0.23%), and English (13.0%, a difference of 0.49%).
| Demographics | Rating | Rank | Disability |
| Irish | 0.0 /100 | #283 | Tragic 12.9% |
| Welsh | 0.0 /100 | #284 | Tragic 12.9% |
| Crow | 0.0 /100 | #285 | Tragic 12.9% |
| English | 0.0 /100 | #286 | Tragic 13.0% |
| Africans | 0.0 /100 | #287 | Tragic 13.0% |
| Whites/Caucasians | 0.0 /100 | #288 | Tragic 13.0% |
| Slovaks | 0.0 /100 | #289 | Tragic 13.0% |
| Cheyenne | 0.0 /100 | #290 | Tragic 13.0% |
| Yaqui | 0.0 /100 | #291 | Tragic 13.1% |
| Aleuts | 0.0 /100 | #292 | Tragic 13.1% |
| Marshallese | 0.0 /100 | #293 | Tragic 13.1% |
| Celtics | 0.0 /100 | #294 | Tragic 13.1% |
| Immigrants | Nonimmigrants | 0.0 /100 | #295 | Tragic 13.2% |
| Central American Indians | 0.0 /100 | #296 | Tragic 13.2% |
| Hopi | 0.0 /100 | #297 | Tragic 13.2% |