Peruvian vs Immigrants from Scotland Ambulatory Disability
COMPARE
Peruvian
Immigrants from Scotland
Ambulatory Disability
Ambulatory Disability Comparison
Peruvians
Immigrants from Scotland
5.7%
AMBULATORY DISABILITY
99.5/ 100
METRIC RATING
69th/ 347
METRIC RANK
6.0%
AMBULATORY DISABILITY
72.1/ 100
METRIC RATING
155th/ 347
METRIC RANK
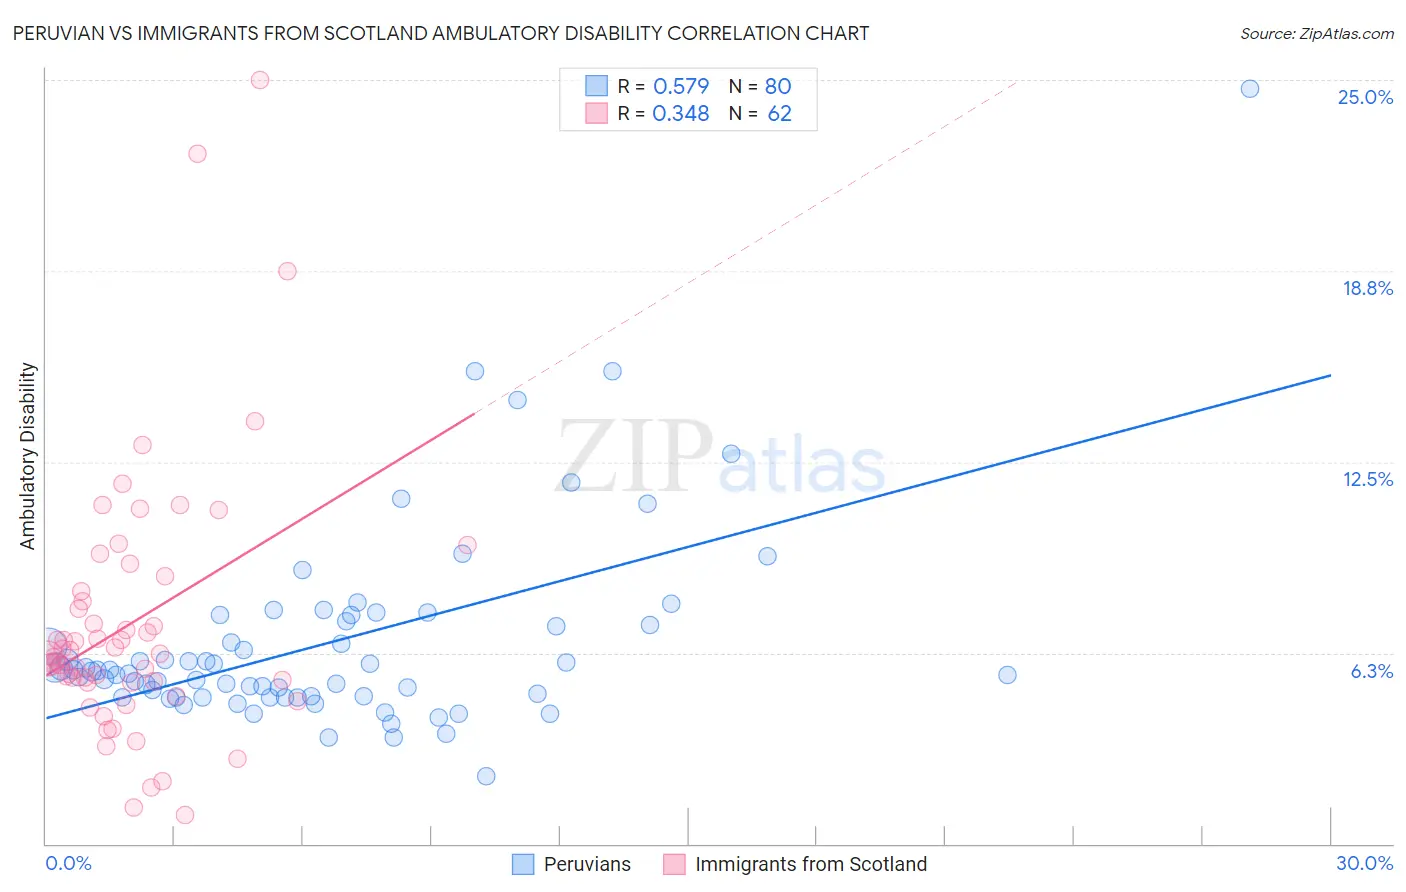
Peruvian vs Immigrants from Scotland Ambulatory Disability Correlation Chart
The statistical analysis conducted on geographies consisting of 363,114,873 people shows a substantial positive correlation between the proportion of Peruvians and percentage of population with ambulatory disability in the United States with a correlation coefficient (R) of 0.579 and weighted average of 5.7%. Similarly, the statistical analysis conducted on geographies consisting of 196,384,965 people shows a mild positive correlation between the proportion of Immigrants from Scotland and percentage of population with ambulatory disability in the United States with a correlation coefficient (R) of 0.348 and weighted average of 6.0%, a difference of 6.2%.
Ambulatory Disability Correlation Summary
| Measurement | Peruvian | Immigrants from Scotland |
| Minimum | 2.2% | 0.96% |
| Maximum | 24.7% | 25.0% |
| Range | 22.5% | 24.0% |
| Mean | 6.6% | 7.2% |
| Median | 5.7% | 6.2% |
| Interquartile 25% (IQ1) | 4.8% | 5.3% |
| Interquartile 75% (IQ3) | 7.2% | 8.2% |
| Interquartile Range (IQR) | 2.4% | 3.0% |
| Standard Deviation (Sample) | 3.3% | 4.4% |
| Standard Deviation (Population) | 3.3% | 4.3% |
Similar Demographics by Ambulatory Disability
Demographics Similar to Peruvians by Ambulatory Disability
In terms of ambulatory disability, the demographic groups most similar to Peruvians are Sierra Leonean (5.7%, a difference of 0.23%), Immigrants from Peru (5.7%, a difference of 0.32%), Brazilian (5.7%, a difference of 0.34%), Immigrants from Northern Africa (5.7%, a difference of 0.36%), and Immigrants from Cameroon (5.7%, a difference of 0.36%).
| Demographics | Rating | Rank | Ambulatory Disability |
| Immigrants | Spain | 99.7 /100 | #62 | Exceptional 5.6% |
| Immigrants | France | 99.7 /100 | #63 | Exceptional 5.6% |
| Laotians | 99.7 /100 | #64 | Exceptional 5.7% |
| Immigrants | Switzerland | 99.7 /100 | #65 | Exceptional 5.7% |
| Israelis | 99.6 /100 | #66 | Exceptional 5.7% |
| Immigrants | Uganda | 99.6 /100 | #67 | Exceptional 5.7% |
| Sri Lankans | 99.6 /100 | #68 | Exceptional 5.7% |
| Peruvians | 99.5 /100 | #69 | Exceptional 5.7% |
| Sierra Leoneans | 99.4 /100 | #70 | Exceptional 5.7% |
| Immigrants | Peru | 99.4 /100 | #71 | Exceptional 5.7% |
| Brazilians | 99.4 /100 | #72 | Exceptional 5.7% |
| Immigrants | Northern Africa | 99.4 /100 | #73 | Exceptional 5.7% |
| Immigrants | Cameroon | 99.4 /100 | #74 | Exceptional 5.7% |
| Immigrants | South Africa | 99.3 /100 | #75 | Exceptional 5.7% |
| Sudanese | 99.3 /100 | #76 | Exceptional 5.7% |
Demographics Similar to Immigrants from Scotland by Ambulatory Disability
In terms of ambulatory disability, the demographic groups most similar to Immigrants from Scotland are Northern European (6.0%, a difference of 0.020%), Ghanaian (6.0%, a difference of 0.050%), Immigrants from Fiji (6.0%, a difference of 0.070%), Immigrants from Latvia (6.0%, a difference of 0.070%), and Central American (6.0%, a difference of 0.15%).
| Demographics | Rating | Rank | Ambulatory Disability |
| Immigrants | Eastern Europe | 82.0 /100 | #148 | Excellent 6.0% |
| Lithuanians | 81.9 /100 | #149 | Excellent 6.0% |
| Maltese | 81.6 /100 | #150 | Excellent 6.0% |
| Greeks | 79.6 /100 | #151 | Good 6.0% |
| Immigrants | Austria | 78.8 /100 | #152 | Good 6.0% |
| Syrians | 75.5 /100 | #153 | Good 6.0% |
| Immigrants | Croatia | 75.1 /100 | #154 | Good 6.0% |
| Immigrants | Scotland | 72.1 /100 | #155 | Good 6.0% |
| Northern Europeans | 71.8 /100 | #156 | Good 6.0% |
| Ghanaians | 71.3 /100 | #157 | Good 6.0% |
| Immigrants | Fiji | 71.2 /100 | #158 | Good 6.0% |
| Immigrants | Latvia | 71.1 /100 | #159 | Good 6.0% |
| Central Americans | 69.8 /100 | #160 | Good 6.0% |
| Immigrants | Belarus | 69.2 /100 | #161 | Good 6.1% |
| Nigerians | 67.1 /100 | #162 | Good 6.1% |