French vs Immigrants from Scotland Ambulatory Disability
COMPARE
French
Immigrants from Scotland
Ambulatory Disability
Ambulatory Disability Comparison
French
Immigrants from Scotland
6.6%
AMBULATORY DISABILITY
0.1/ 100
METRIC RATING
269th/ 347
METRIC RANK
6.0%
AMBULATORY DISABILITY
72.1/ 100
METRIC RATING
155th/ 347
METRIC RANK
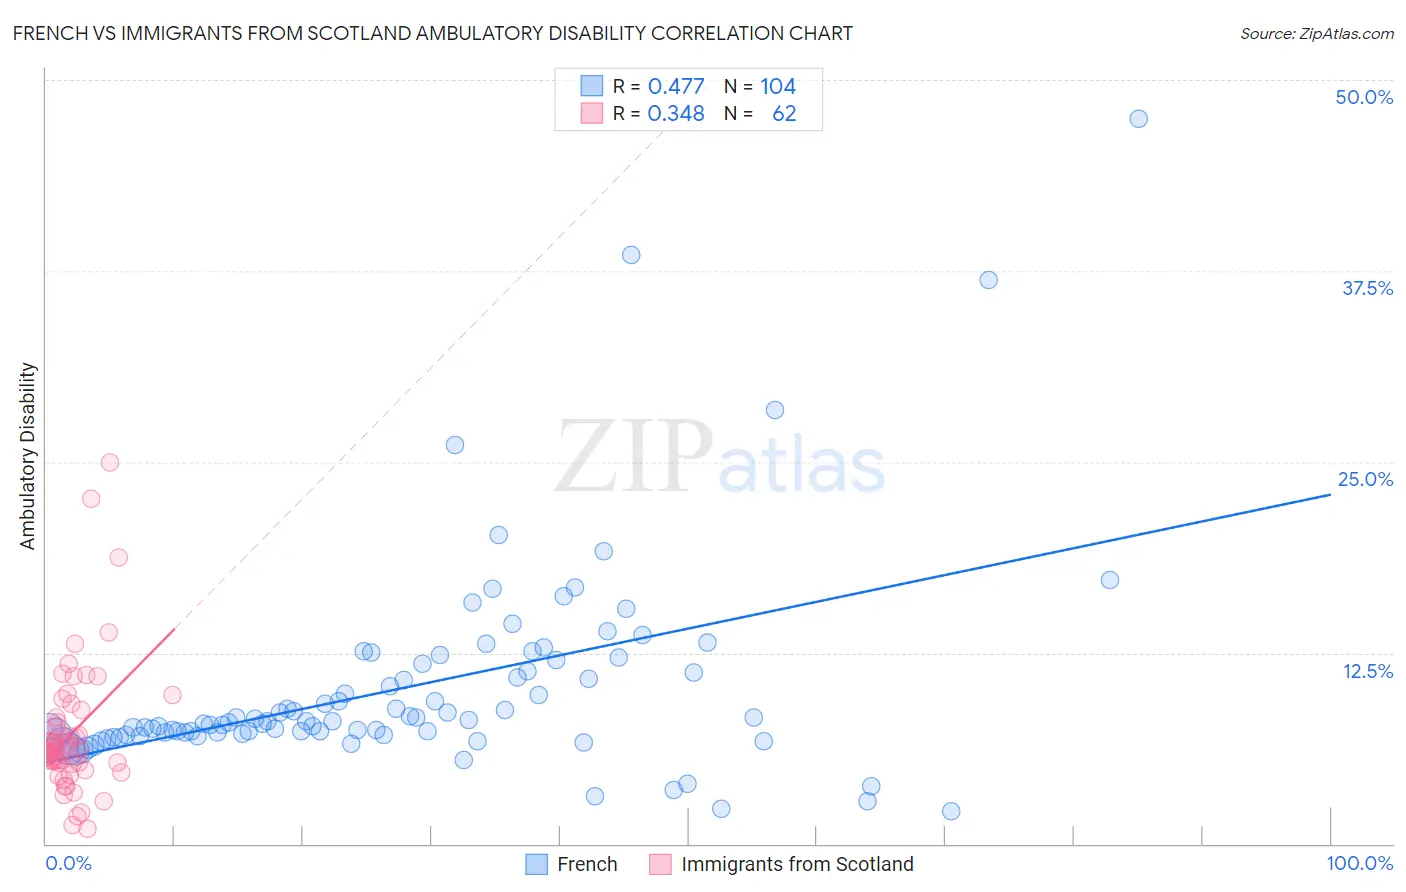
French vs Immigrants from Scotland Ambulatory Disability Correlation Chart
The statistical analysis conducted on geographies consisting of 571,874,701 people shows a moderate positive correlation between the proportion of French and percentage of population with ambulatory disability in the United States with a correlation coefficient (R) of 0.477 and weighted average of 6.6%. Similarly, the statistical analysis conducted on geographies consisting of 196,384,965 people shows a mild positive correlation between the proportion of Immigrants from Scotland and percentage of population with ambulatory disability in the United States with a correlation coefficient (R) of 0.348 and weighted average of 6.0%, a difference of 10.1%.
Ambulatory Disability Correlation Summary
| Measurement | French | Immigrants from Scotland |
| Minimum | 2.1% | 0.96% |
| Maximum | 47.5% | 25.0% |
| Range | 45.4% | 24.0% |
| Mean | 10.2% | 7.2% |
| Median | 8.0% | 6.2% |
| Interquartile 25% (IQ1) | 7.2% | 5.3% |
| Interquartile 75% (IQ3) | 11.6% | 8.2% |
| Interquartile Range (IQR) | 4.4% | 3.0% |
| Standard Deviation (Sample) | 6.9% | 4.4% |
| Standard Deviation (Population) | 6.8% | 4.3% |
Similar Demographics by Ambulatory Disability
Demographics Similar to French by Ambulatory Disability
In terms of ambulatory disability, the demographic groups most similar to French are Slovak (6.7%, a difference of 0.16%), Immigrants from Trinidad and Tobago (6.7%, a difference of 0.26%), Spanish (6.6%, a difference of 0.31%), Trinidadian and Tobagonian (6.6%, a difference of 0.32%), and Guyanese (6.6%, a difference of 0.45%).
| Demographics | Rating | Rank | Ambulatory Disability |
| English | 0.4 /100 | #262 | Tragic 6.6% |
| Hmong | 0.3 /100 | #263 | Tragic 6.6% |
| Nepalese | 0.2 /100 | #264 | Tragic 6.6% |
| Bahamians | 0.2 /100 | #265 | Tragic 6.6% |
| Guyanese | 0.2 /100 | #266 | Tragic 6.6% |
| Trinidadians and Tobagonians | 0.2 /100 | #267 | Tragic 6.6% |
| Spanish | 0.2 /100 | #268 | Tragic 6.6% |
| French | 0.1 /100 | #269 | Tragic 6.6% |
| Slovaks | 0.1 /100 | #270 | Tragic 6.7% |
| Immigrants | Trinidad and Tobago | 0.1 /100 | #271 | Tragic 6.7% |
| French Canadians | 0.1 /100 | #272 | Tragic 6.7% |
| Whites/Caucasians | 0.1 /100 | #273 | Tragic 6.7% |
| Sioux | 0.1 /100 | #274 | Tragic 6.7% |
| Immigrants | Guyana | 0.1 /100 | #275 | Tragic 6.7% |
| Celtics | 0.1 /100 | #276 | Tragic 6.7% |
Demographics Similar to Immigrants from Scotland by Ambulatory Disability
In terms of ambulatory disability, the demographic groups most similar to Immigrants from Scotland are Northern European (6.0%, a difference of 0.020%), Ghanaian (6.0%, a difference of 0.050%), Immigrants from Fiji (6.0%, a difference of 0.070%), Immigrants from Latvia (6.0%, a difference of 0.070%), and Central American (6.0%, a difference of 0.15%).
| Demographics | Rating | Rank | Ambulatory Disability |
| Immigrants | Eastern Europe | 82.0 /100 | #148 | Excellent 6.0% |
| Lithuanians | 81.9 /100 | #149 | Excellent 6.0% |
| Maltese | 81.6 /100 | #150 | Excellent 6.0% |
| Greeks | 79.6 /100 | #151 | Good 6.0% |
| Immigrants | Austria | 78.8 /100 | #152 | Good 6.0% |
| Syrians | 75.5 /100 | #153 | Good 6.0% |
| Immigrants | Croatia | 75.1 /100 | #154 | Good 6.0% |
| Immigrants | Scotland | 72.1 /100 | #155 | Good 6.0% |
| Northern Europeans | 71.8 /100 | #156 | Good 6.0% |
| Ghanaians | 71.3 /100 | #157 | Good 6.0% |
| Immigrants | Fiji | 71.2 /100 | #158 | Good 6.0% |
| Immigrants | Latvia | 71.1 /100 | #159 | Good 6.0% |
| Central Americans | 69.8 /100 | #160 | Good 6.0% |
| Immigrants | Belarus | 69.2 /100 | #161 | Good 6.1% |
| Nigerians | 67.1 /100 | #162 | Good 6.1% |